#1 in Lead Generation for Massachusetts Realtors
A Powerful All-In-One Real Estate Lead Generation Platform to Connect Agents with Serious Home Buyers & Sellers.
Save now with CINC's special promotion for new clients. $3,000 lead gen offer & guaranteed sales. Claim your offer today!
Buyer Lead Generation
Seller Lead Generation
Targeted Hyperlocal Leads
Request a demo
Request a demo
FILL YOUR PIPELINE WITH LEADS...AND KEEP IT FULL
Complete Real Estate Lead Generation Cycle
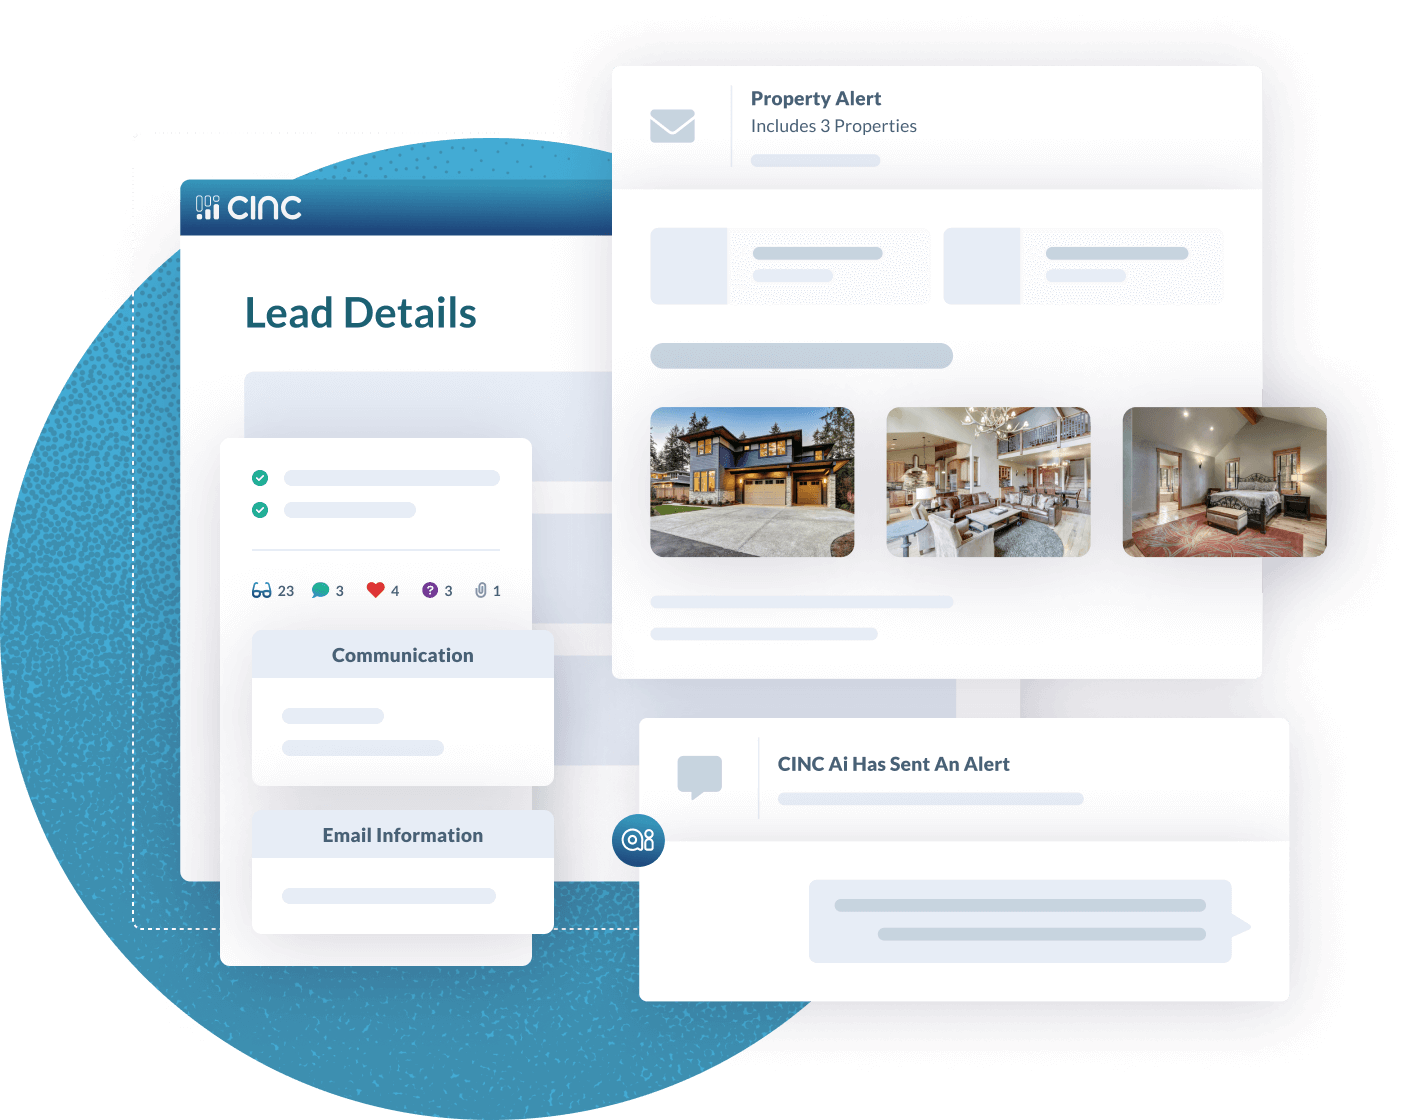
CINC will provide the leads and the automated and integrated tools you need to generate, follow up with, and close new deals.

Buyer Leads
Get hyper-local, highly-qualified leads generated for you by CINC's full-service team of Google Premier and Facebook Premium partners, which manages more than $30 million in annual ad spend on behalf of CINC clients.

Top Submarket Data
Access CINC's proprietary data on the top local submarkets for real estate leads within 10 miles of a city center.

Seller Leads
Tailor your efforts with insights on lead motivations, buyer stage, and other critical data points.
Massachusetts Real Estate Buyer & Seller Cost Per Lead (CPL) Market Data:
Massachusetts Real Estate Lead Generation updates for 2023. New data from Boston and Providence.
| Rank | Market | Buyer CPL | Seller CPL |
|---|---|---|---|
| 10 | Boston-Cambridge-Newton, MA-NH | $7.13 | $17.75 |
| 38 | Providence-Warwick, RI-MA | $6.25 | $11.46 |
Boston Cost Per Lead (CPL) Data:
Here are the top local submarkets for real estate leads within 5 miles of center of Boston (according to CINC's proprietary data from Google):
| Distance (Mi) | Area | CPL | Lead Volume |
|---|---|---|---|
| 0 | Boston MA | $7.13 | |
| 0 | Brookline MA | $9.01 | Medium |
| 1.52 | Jamaica Plain MA | $5.16 | Medium-Low |
| 2.16 | Back Bay MA | $7.07 | Medium-High |
| 2.3 | Chestnut Hill MA | $8.79 | Medium-Low |
| 4.51 | Newton MA | $9.06 | Medium-Low |
| 5.32 | Belmont MA | Request Demo to Unlock Data | Low |
| 6.4 | Milton MA | Request Demo to Unlock Data | Low |
| 6.61 | Waltham MA | Request Demo to Unlock Data | Low |
| 6.92 | Needham MA | Request Demo to Unlock Data | Low |
| 8.16 | Quincy MA | Request Demo to Unlock Data | Low |
| 9.09 | Wellesley MA | Request Demo to Unlock Data | High |
| 9.7 | Westwood MA | Request Demo to Unlock Data | Low |
| 9.8 | Dover MA | Request Demo to Unlock Data | Low |
| 10.31 | Woburn MA | Request Demo to Unlock Data | Low |
| 10.45 | Braintree MA | Request Demo to Unlock Data | Medium-Low |
| 12.03 | Weymouth MA | Request Demo to Unlock Data | High |
| 12.12 | Natick MA | Request Demo to Unlock Data | Low |
| 13.36 | Hingham MA | Request Demo to Unlock Data | Medium-High |
| 13.83 | Norfolk County MA | Request Demo to Unlock Data | Low |
| 14.04 | Hull MA | Request Demo to Unlock Data | High |
| 14.16 | Swampscott MA | Request Demo to Unlock Data | Low |
| 14.32 | Stoughton MA | Request Demo to Unlock Data | Medium-High |
| 14.63 | Concord MA | Request Demo to Unlock Data | Low |
| 15.51 | Framingham MA | Request Demo to Unlock Data | Medium-Low |
| 16.21 | Middlesex County MA | Request Demo to Unlock Data | Low |
| 16.56 | Salem MA | Request Demo to Unlock Data | High |
| 16.73 | Peabody MA | Request Demo to Unlock Data | Low |
| 17.38 | Cohasset MA | Request Demo to Unlock Data | Medium |
| 17.77 | Marblehead MA | Request Demo to Unlock Data | Medium-High |
| 19.43 | Danvers MA | Request Demo to Unlock Data | Low |
Providence Cost Per Lead (CPL) Data:
Here are the top local submarkets for real estate leads within 5 miles of center of Providence (according to CINC's proprietary data from Google):
| Distance (Mi) | Area | CPL | Lead Volume |
|---|---|---|---|
| 0 | Providence RI | $6.25 | Medium-High |
| 0.18 | Rhode Island TRIAL RI | $7.19 | High |
| 2.31 | East Providence RI | $5.92 | Low |
| 3.04 | Edgewood RI | $3.79 | Low |
| 3.3 | Cranston RI | $9.65 | Low |
| 3.48 | North Providence RI | Request Demo to Unlock Data | Low |
| 4.09 | Pawtucket RI | Request Demo to Unlock Data | Low |
| 4.32 | Pawtuxet Village RI | Request Demo to Unlock Data | Medium-High |
| 4.84 | Johnston RI | Request Demo to Unlock Data | Low |
| 6.2 | Lincoln RI | Request Demo to Unlock Data | Low |
| 7.87 | Barrington RI | Request Demo to Unlock Data | Low |
| 8.16 | Warwick RI | Request Demo to Unlock Data | Medium |
| 9.76 | Smithfield RI | Request Demo to Unlock Data | Low |
| 10.02 | West Warwick RI | Request Demo to Unlock Data | Low |
| 10.24 | Cumberland RI | Request Demo to Unlock Data | Low |
| 10.47 | North Attleboro MA | Request Demo to Unlock Data | High |
| 10.59 | Attleboro MA | Request Demo to Unlock Data | High |
| 10.83 | Scituate RI | Request Demo to Unlock Data | Low |
| 12.11 | North Smithfield RI | Request Demo to Unlock Data | Medium-Low |
| 12.18 | Coventry RI | Request Demo to Unlock Data | Medium-Low |
| 12.66 | Bristol RI | Request Demo to Unlock Data | Medium-High |
| 14.09 | East Greenwich RI | Request Demo to Unlock Data | Low |
| 15.35 | Glocester RI | Request Demo to Unlock Data | Medium |
| 16.34 | Blackstone MA | Request Demo to Unlock Data | Low |
| 16.58 | Mansfield MA | Request Demo to Unlock Data | Low |
| 17.09 | Burrillville RI | Request Demo to Unlock Data | Medium-High |
| 17.12 | Tiverton RI | Request Demo to Unlock Data | Medium-Low |
| 17.33 | Wrentham MA | Request Demo to Unlock Data | Low |
| 17.46 | Portsmouth RI | Request Demo to Unlock Data | Medium-Low |
| 17.94 | Franklin MA | Request Demo to Unlock Data | Medium-Low |
| 18.43 | Bellingham MA | Request Demo to Unlock Data | Low |
| 18.58 | North Kingstown RI | Request Demo to Unlock Data | Medium |
| 19.48 | Raynham MA | Request Demo to Unlock Data | High |


 4.7
4.7 4.6
4.6 4.6
4.6 4.5
4.5