#1 in Lead Generation for New Jersey Realtors
A Powerful All-In-One Real Estate Lead Generation Platform to Connect Agents with Serious Home Buyers & Sellers.
Save now with CINC's special promotion for new clients. $3,000 lead gen offer & guaranteed sales. Claim your offer today!
Buyer Lead Generation
Seller Lead Generation
Targeted Hyperlocal Leads
Request a demo
Request a demo
FILL YOUR PIPELINE WITH LEADS...AND KEEP IT FULL
Complete Real Estate Lead Generation Cycle
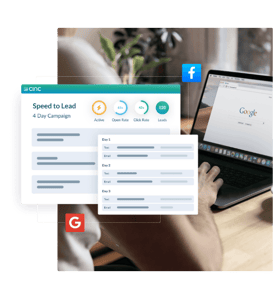
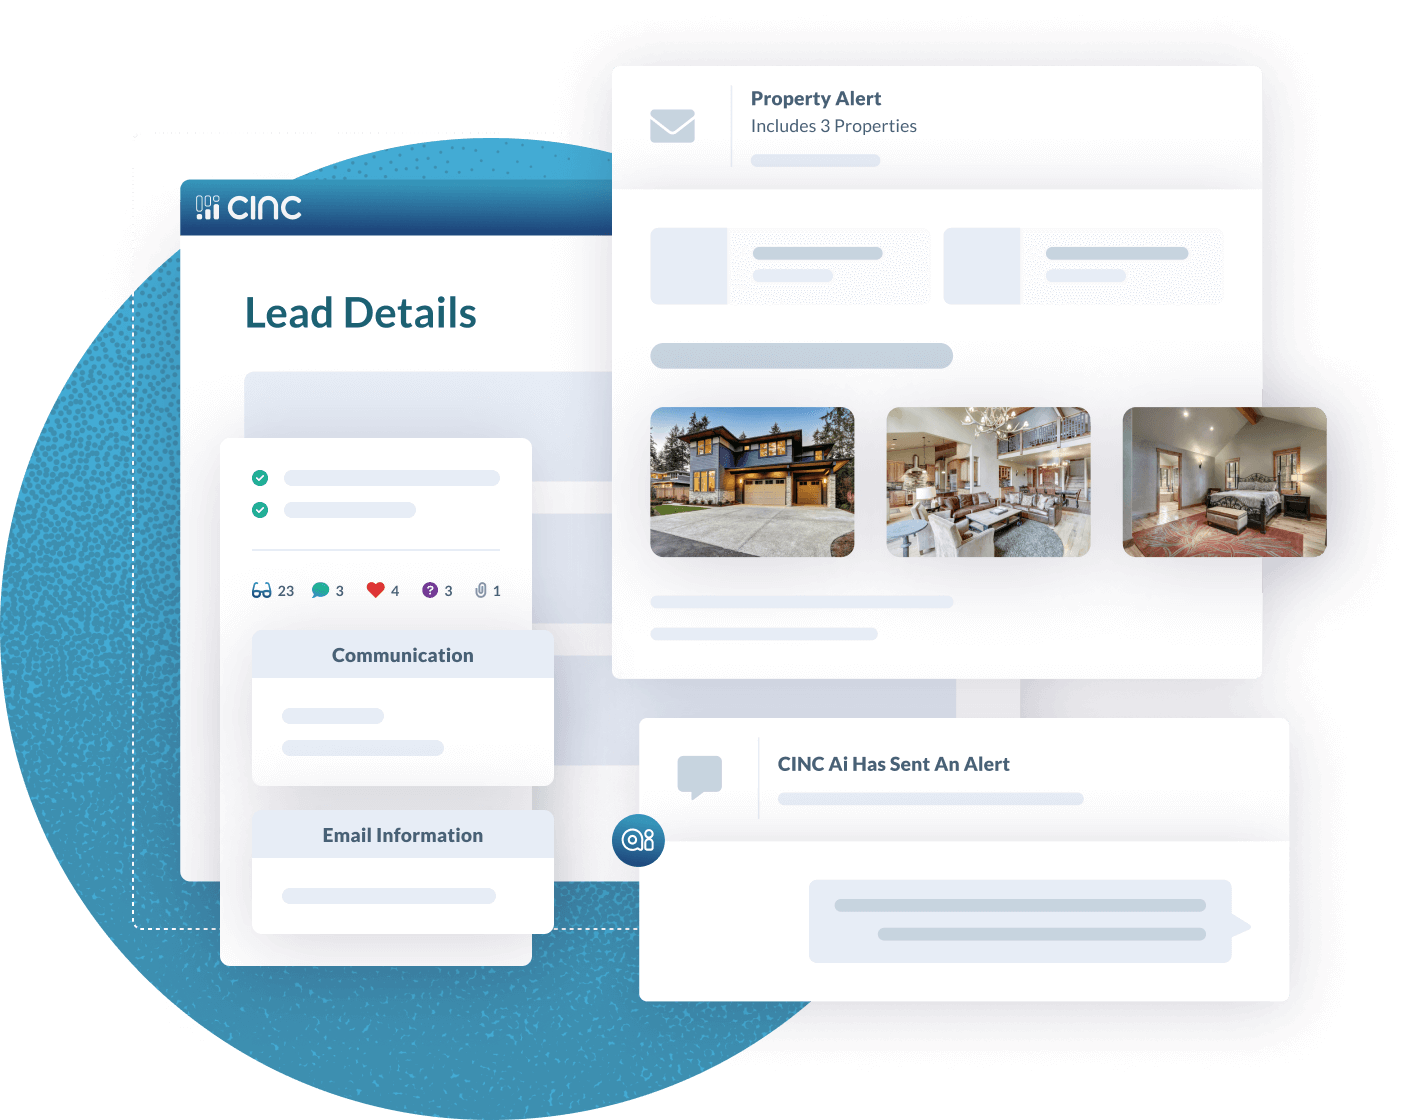
CINC will provide the leads and the automated and integrated tools you need to generate, follow up with, and close new deals.

Buyer Leads
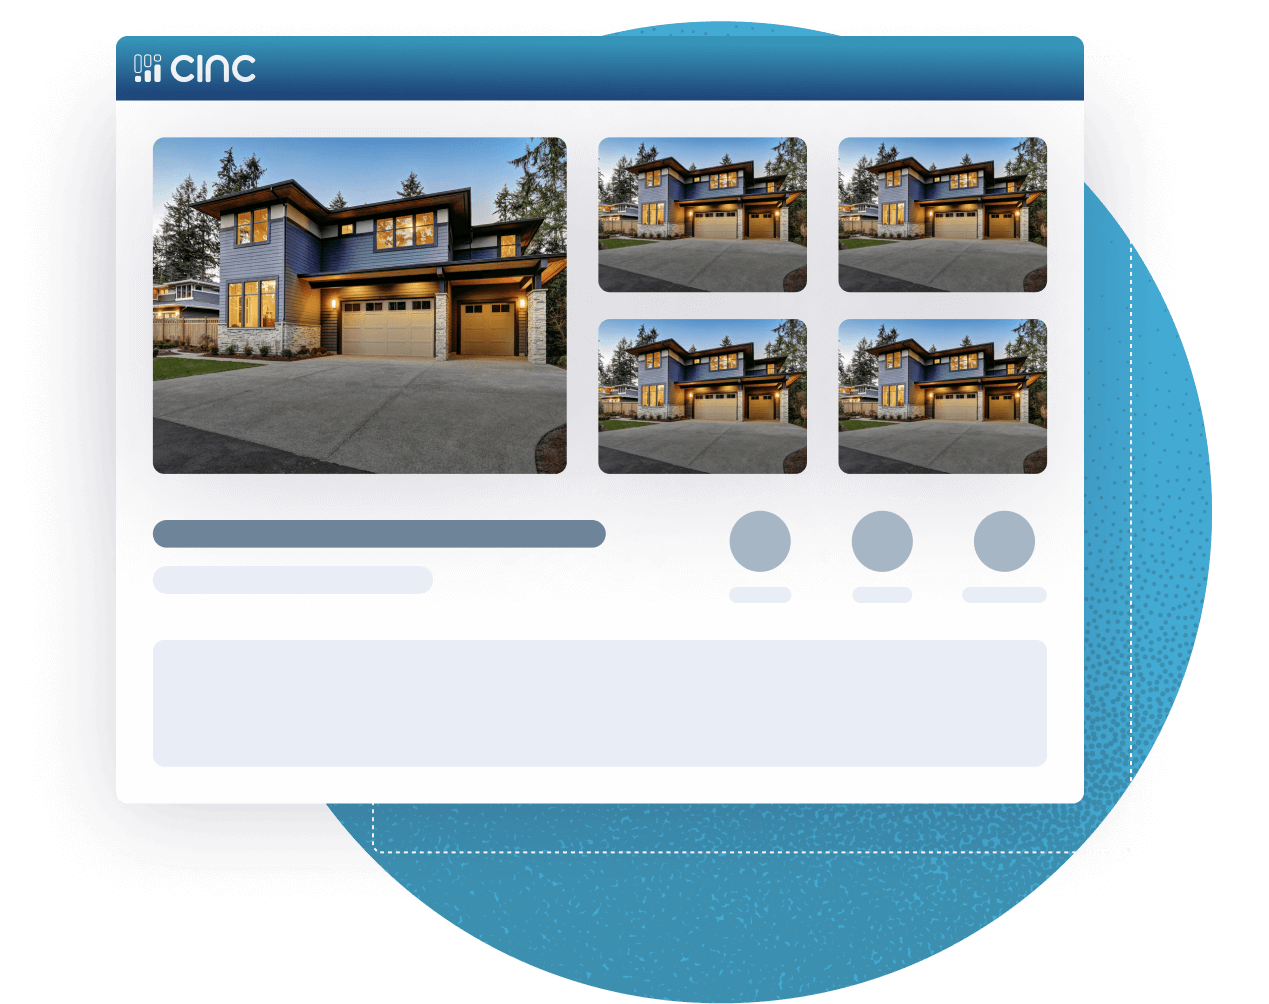
Get hyper-local, highly-qualified leads generated for you by CINC's full-service team of Google Premier and Facebook Premium partners, which manages more than $30 million in annual ad spend on behalf of CINC clients.

Top Submarket Data
Access CINC's proprietary data on the top local submarkets for real estate leads within 10 miles of a city center.

Seller Leads
Tailor your efforts with insights on lead motivations, buyer stage, and other critical data points.
New Jersey Real Estate Buyer & Seller Cost Per Lead (CPL) Market Data:
New Jersey Real Estate Lead Generation updates for 2023. New data from Jersey City, Philadelphia and Allentown.
| National Rank | Market | Buyer CPL | Seller CPL |
|---|---|---|---|
| 1 | New York-Newark-Jersey City, NY-NJ-PA | $7.64 | $16.38 |
| 6 | Philadelphia-Camden-Wilmington, PA-NJ-DE-MD | $6.09 | $15.69 |
| 68 | Allentown-Bethlehem-Easton, PA-NJ | $3.73 | NA |
Jersey City Cost Per Lead (CPL) Data:
Here are the top local submarkets for real estate leads within 5 miles of center of Jersey City (according to CINC's proprietary data from Google):
| Distance (Mi) | Area | CPL | Lead Volume |
|---|---|---|---|
| 0 | Jersey City NJ | $7.64 | Low |
| 2.6 | Hudson County NJ | $4.21 | Low |
| 5.4 | Media DE | $5.37 | Medium-High |
| 5.55 | Kearny NJ | $5.60 | Low |
| 6.68 | Elizabeth NJ | $10.99 | Medium-Low |
| 7.53 | Lyndhurst NJ | Request Demo to Unlock Data | Low |
| 7.7 | Todt Hill NY | Request Demo to Unlock Data | Low |
| 8.27 | Hillside NJ | Request Demo to Unlock Data | High |
| 8.99 | Nutley NJ | Request Demo to Unlock Data | Medium |
| 9.99 | 10306 NY | Request Demo to Unlock Data | Low |
| 10.05 | Union NJ | Request Demo to Unlock Data | High |
| 10.56 | Roselle Park NJ | Request Demo to Unlock Data | Medium-High |
| 10.57 | Essex County NJ | Request Demo to Unlock Data | High |
| 10.59 | Roselle NJ | Request Demo to Unlock Data | High |
| 10.72 | Montclair NJ | Request Demo to Unlock Data | Low |
| 10.83 | Staten Island NY | Request Demo to Unlock Data | Medium-High |
| 11.08 | Fort Lee NJ | Request Demo to Unlock Data | Low |
| 11.69 | Kenilworth NJ | Request Demo to Unlock Data | Medium-Low |
| 11.93 | Carteret NJ | Request Demo to Unlock Data | Low |
| 12.22 | Hackensack NJ | Request Demo to Unlock Data | Low |
| 12.45 | Cranford NJ | Request Demo to Unlock Data | Medium-High |
| 12.84 | Union County NJ | Request Demo to Unlock Data | High |
| 12.88 | Rahway NJ | Request Demo to Unlock Data | Medium-High |
Philadelphia Cost Per Lead (CPL) Data:
Here are the top local submarkets for real estate leads within 5 miles of center of Philadelphia (according to CINC's proprietary data from Google):
| Distance (Mi) | Area | CPL | Lead Volume |
|---|---|---|---|
| 0 | Philadelphia PA | $6.09 | High |
| 1.22 | Old City PA | $11.67 | Low |
| 1.37 | Passyunk Square PA | $7.19 | Low |
| 2.97 | South Philadelphia PA | $7.98 | Low |
| 3.06 | West Philadelphia PA | $6.63 | Medium-Low |
| 3.1 | Packer Park PA | Request Demo to Unlock Data | Medium-High |
| 5.28 | 19151 PA | Request Demo to Unlock Data | Low |
| 5.49 | Bala Cynwyd PA | Request Demo to Unlock Data | Low |
| 5.61 | 19137 PA | Request Demo to Unlock Data | Low |
| 5.84 | Lower Merion PA | Request Demo to Unlock Data | Low |
| 5.98 | Manayunk PA | Request Demo to Unlock Data | Low |
| 6.42 | Narberth PA | Request Demo to Unlock Data | Low |
| 6.81 | Drexel Hill PA | Request Demo to Unlock Data | High |
| 7.46 | Ardmore PA | Request Demo to Unlock Data | Low |
| 7.46 | 19128 PA | Request Demo to Unlock Data | Low |
| 7.85 | Haddonfield NJ | Request Demo to Unlock Data | Low |
| 7.92 | Havertown PA | Request Demo to Unlock Data | Medium-Low |
| 8.36 | Elkins Park PA | Request Demo to Unlock Data | Medium |
| 8.42 | Springfield PA | Request Demo to Unlock Data | Low |
| 8.43 | West Deptford NJ | Request Demo to Unlock Data | Low |
| 8.47 | Chestnut Hill PA | Request Demo to Unlock Data | High |
| 8.69 | 19111 PA | Request Demo to Unlock Data | Low |
| 9.02 | Cheltenham Twp PA | Request Demo to Unlock Data | High |
| 9.71 | Bryn Mawr PA | Request Demo to Unlock Data | Low |
| 9.76 | Broomall PA | Request Demo to Unlock Data | Low |
| 10.13 | Jenkintown PA | Request Demo to Unlock Data | Medium-Low |
Allentown Per Lead (CPL) Data:
Here are the top local submarkets for real estate leads within 5 miles of center of Allentown (according to CINC's proprietary data from Google):
| Distance (Mi) | Area | CPL | Lead Volume |
|---|---|---|---|
| 0 | Allentown PA | $10.08 | Medium |
| 3.4 | Whitehall PA | $8.24 | Low |
| 3.49 | Parkland SD PA | $7.53 | Medium-Low |
| 4.19 | Lehigh Valley PA | $8.57 | High |
| 4.77 | Emmaus PA | $8.57 | Low |
| 5.29 | Saucon Valley PA | Request Demo to Unlock Data | Low |
| 5.37 | Lehigh County PA | Request Demo to Unlock Data | Medium-High |
| 6.39 | Bethlehem PA | Request Demo to Unlock Data | High |
| 6.93 | Upper Macungie PA | Request Demo to Unlock Data | Low |
| 7.24 | Macungie PA | Request Demo to Unlock Data | Low |
| 8.5 | Coopersburg PA | Request Demo to Unlock Data | Low |
| 9.76 | Saucon Valley SD PA | Request Demo to Unlock Data | Low |
| 13.91 | Quakertown PA | Request Demo to Unlock Data | High |
| 15.03 | Pennsburg PA | Request Demo to Unlock Data | Low |
| 15.17 | Easton PA | Request Demo to Unlock Data | Medium-Low |
| 15.41 | Northampton County PA | Request Demo to Unlock Data | Low |
| 16.69 | Kunkletown PA | Request Demo to Unlock Data | Low |
| 19.35 | Perkasie PA | Request Demo to Unlock Data | Medium-Low |
| 19.64 | Perkiomenville PA | Request Demo to Unlock Data | Low |


 4.7
4.7 4.6
4.6 4.6
4.6 4.5
4.5