

.svg)

.png)


%20(1).png?width=600&name=Q2%202022%20Google%20Buyer%20Real%20Estate%20Lead%20Cost%20Report%20(600%20%C3%97%20350%20px)%20(1).png)
CINC's portfolio of $30MM in managed ad spend on Google for real estate teams and agents saw the buyer cost per lead (CPL) increase during the 2nd quarter of 2022 due to the general slowing down of the real estate market (you can download the full report here). This slowdown caused home buying search traffic to decrease, which in turn sent the lead price higher.
It is basic supply and demand. Supply (volume of home buyer searches on Google) simply has not kept up with demand (realtor ad spend to find home buyers searching on Google), which has caused higher prices.
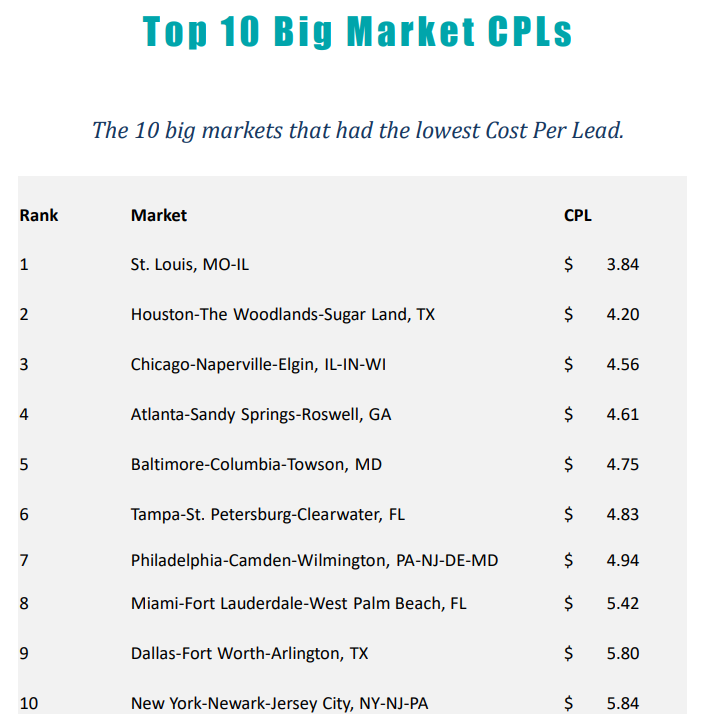
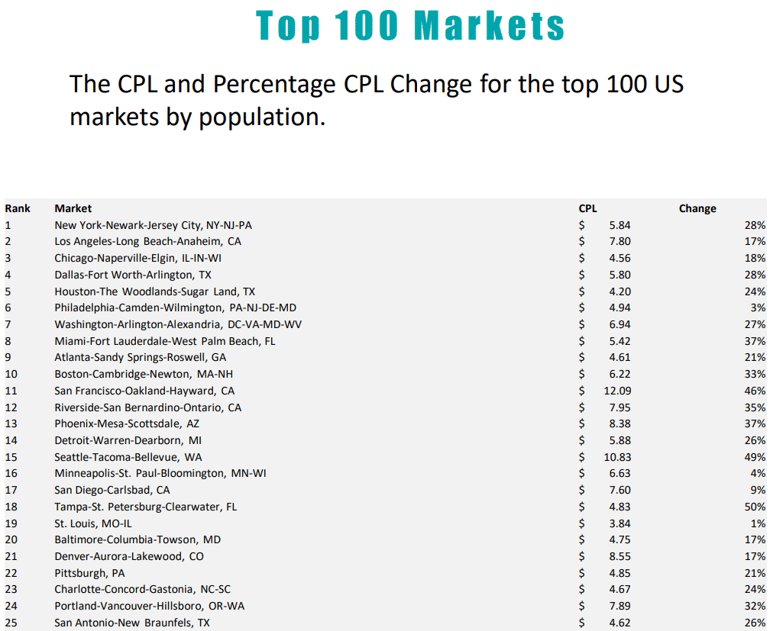
Despite the increase in lead price, many markets still have low CPLs.
Chicago, Houston, Philadelphia, Atlanta, Tampa, St. Louis, and Baltimore enjoy the lowest cost per leads of major markets.
Each market is less than $5 per lead. San Francisco and Seattle are the only two markets with a CPL higher than $10.
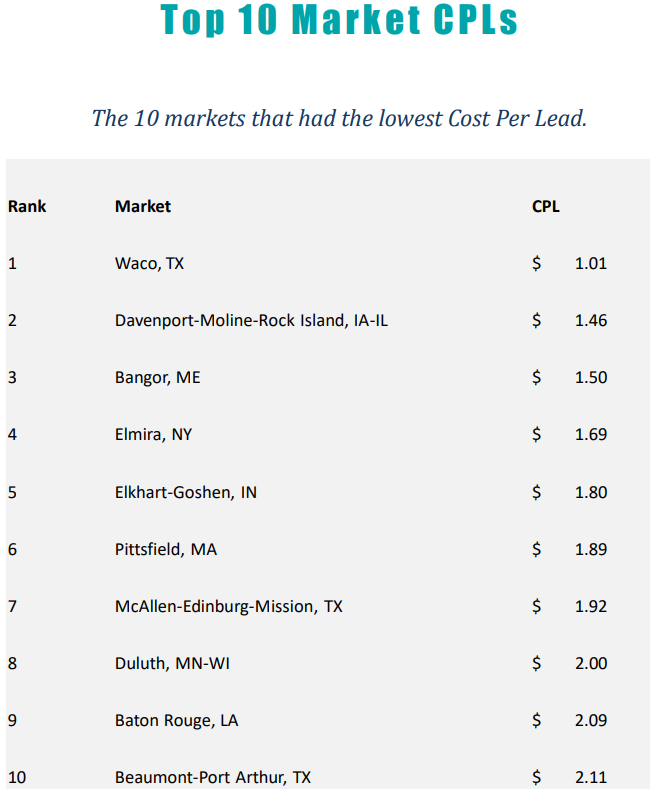
For all markets, Waco (TX), Davenport (IA), and Bangor (ME) were the top 3 markets for lowest cost per lead in our portfolio. Each are below $1.50 a lead.
Texas was well represented with 2 other cities (McAllen-Edinburg-Mission and Beaumont-Port Arthur) also in the top 10 lowest cost per lead markets.
For the Top 25 largest markets, St. Louis (+1% CPL change), Philadelphia (+3%), and Minneapolis (+4%) saw the slowest growth in CPL. Tampa (+50% CPL change), Seattle (+49%), and San Francisco (+46%) saw the largest growth in CPL during in Q2.
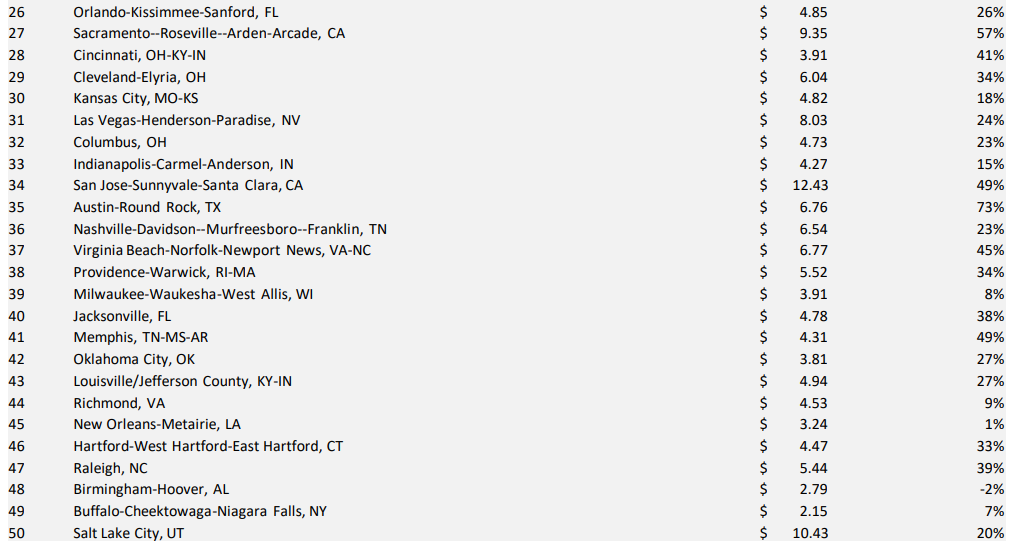
For 26th-50th largest markets, Birmingham (-2% CPL change), New Orleans (+7%), and Milwaukee (+8%) saw the slowest growth in CPL. Austin (+73% CPL change), Sacramento (+57%), and San Jose (+49%) saw the largest growth in CPL during in Q2.
For 51st-75th largest markets, Baton Rouge, LA (-49% CPL change), Honolulu, HI (-13%), and Allentown, PA (-8%) saw the slowest growth in CPL. Bridgeport, CT (+86% CPL change), Sarasota, FL (+46%), and Bakersfield, CA (+40%) saw the largest growth in CPL during in Q2.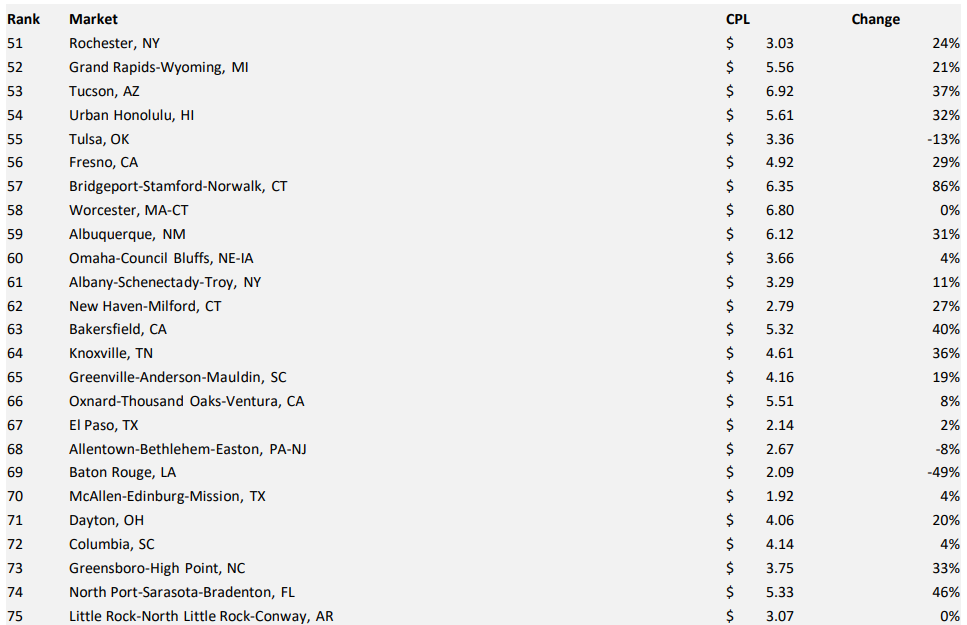
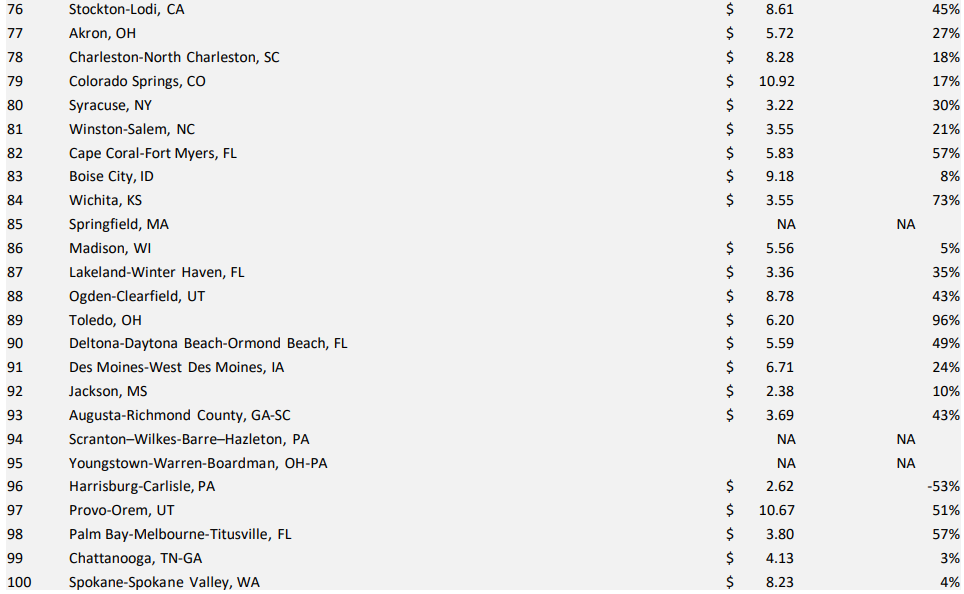
For 76th-100th largest markets, Harrisburg, PA (-53% CPL change), Chattanooga, TN (+3%), and Spokane, WA (+4%) saw the slowest growth in CPL. Toledo, OH (+96% CPL change), Wichita, KS (+73%), and Fort Myers, FL (+57%) saw the largest growth in CPL during in Q2.
The second quarter 2022 CPL was higher than first quarter 2022 and higher than the second quarter of 2021. We don't expect to see another jump in CPL like we had in the second quarter. However, typically the third quarter and the fourth quarter have higher CPLs than the second quarter, so we expect CPLs to continue to rise for the remainder of the year.
You can access the full detailed report here.
Additional Google Real Estate Lead Gen Resources from CINC:
With buyer cost per lead up on Google in Q2, it is more important than ever to be more efficient paying for leads on Google. Try our free Google targeting tool here to find hidden pockets of more cost effective hyper-local leads near you.
Watch our on-demand lead gen webinar from July here where we discuss new trends for real estate teams and agents on Google Ads, including a deep dive on Google Local Service Ads (LSA's) for realtors.
Here are links to past historic Buyer Cost Per Lead Reports for Q1 2022, Q4 2021, Q3 2021, Q2 2021, Q1 2021, Q4 2020, Q3 2020, Q2 2020, Q1 2020.