Unlike the buyer lead market (you can see the the updated Q2 2022 Google Buyer Real Estate Lead Cost Report ) , the price for seller leads on Google dropped during the second quarter, after multiple quarters of seller lead price growth.
CINC's portfolio of $30MM in managed ad spend on Google for real estate teams and agents saw the seller cost per lead (CPL) improve (decline in cost) in eleven of the top 20 markets year-over-year in the 2nd quarter (you can download the full Q2 2022 Google Seller Real Estate Lead Cost Report here).
This decrease in seller lead cost followed along the broader housing market trend of inventory levels starting to rise. NAR reported in June 2022 that months' supply inventory of existing homes was up 20% year-over-year and 15% month-over-month.
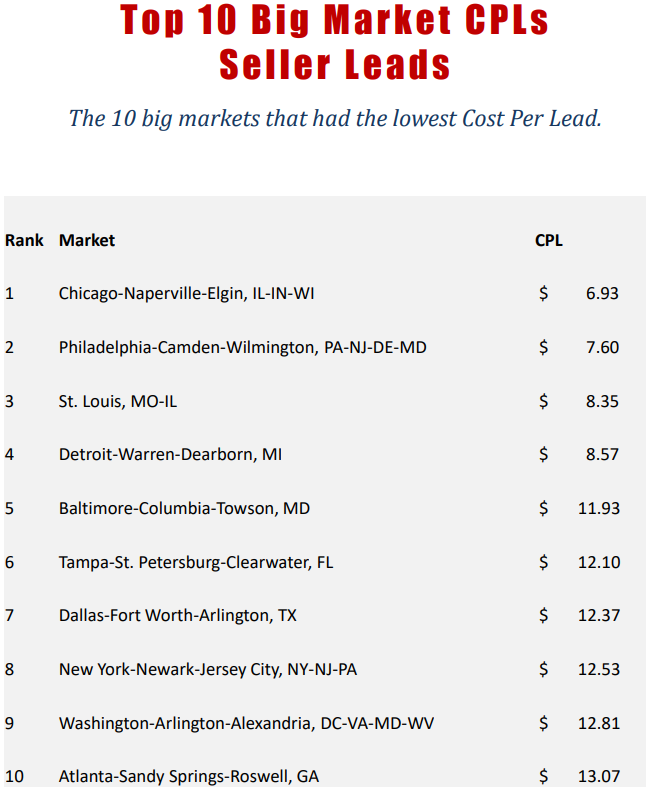
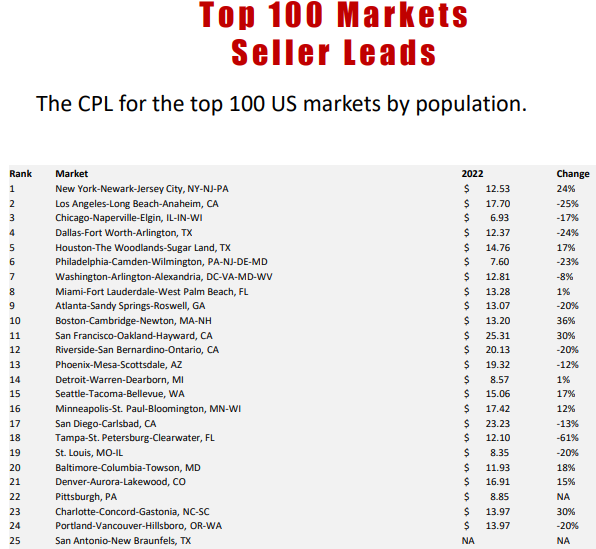
Some of the biggest gains in Google seller lead price improvement were in Los Angeles, Dallas, and Philadelphia. The biggest improvement was seen in Tampa, whose CPL decreased a significant 61 percent.
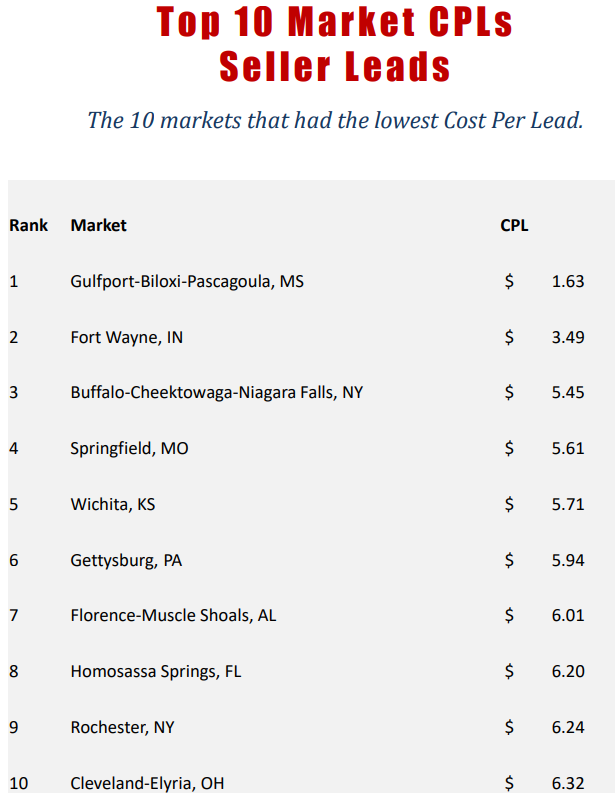
The lowest cost per lead (CPL) is in Gulfport, Mississippi at $1.63 followed by Fort Wayne, Indiana and Buffalo, New York.
There remains a big disparity between the high CPL cities and the low CPL cities. The highest CPLs are in California cities: San Francisco, Riverside, and San Diego. These are all over $20 a lead. The most affordable big cities are Chicago, Detroit, Philadelphia and St. Louis which are all under $10 a lead.
Despite the increase in lead price, many markets still have low CPLs.
For the Top 25 largest markets, Tampa (-61% CPL change), Los Angeles (-25%), and Dallas (-24%) saw the most improvement in CPL. Boston (+36% CPL change), San Francisco (+30%), and Charlotte (+30%) saw the largest increase in CPL during Q2.
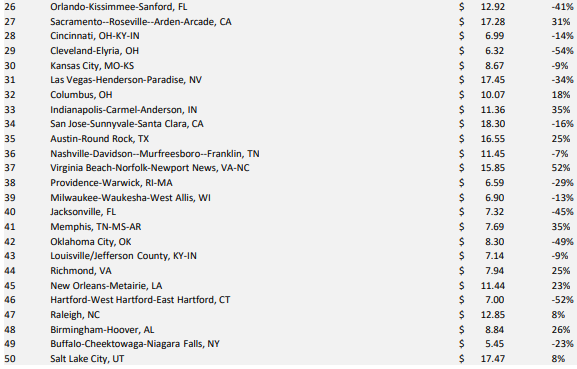
For 26th-50th largest markets, Cleveland, OH (-54% CPL change), Hartford, CT (-52%), and Oklahoma City, OK (-49%) saw the most improvement in CPL. Virginia Beach, VA (+52% CPL change), Birmingham, AL (+26%), and Indianapolis, IN (+35%) saw the largest increase in CPL during in Q2.
For 51st-75th largest markets, Sarasota, FL (-71% CPL change), Bakersfield, CA (-35%), and Tucson, AZ (-30%) saw the most improvement in CPL. Columbia, SC (+222% CPL change), Omaha, NE (+105%), and Honolulu, HI (+58%) saw the largest increase in CPL during in Q2.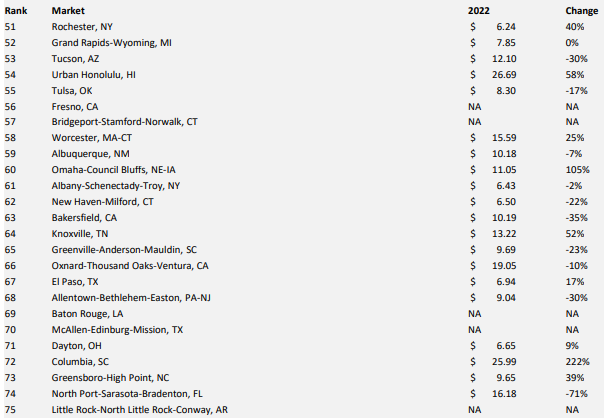
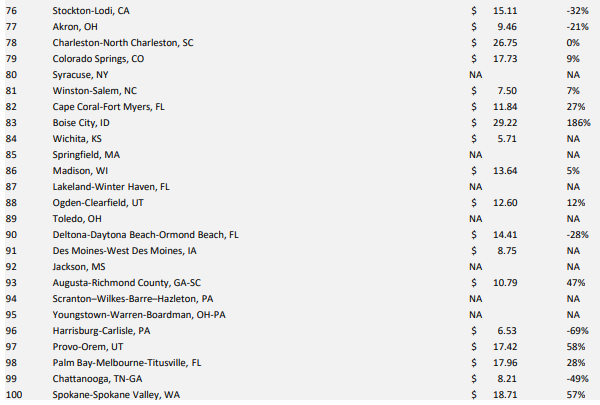
For 76th-100th largest markets, Harrisburg, PA (-69% CPL change), Chattanooga, TN (-49%), and Stockton, CA (-32%) saw the most improvement in CPL. Boise, ID (+186% CPL change), Provo, UT (+58%), and Spokane, WA (+57%) saw the largest increase in CPL during in Q2.
We expect the cost per lead to remain consistent with last year. Although home search traffic has declined - which has caused the cost per lead for buyer leads to increase - the traffic for home selling is steady.
You can access the full detailed report here.
Additional Google Real Estate Lead Gen Resources from CINC:
With the real estate seller lead cost improving on Google in Q2, you can find incredible, cost efficient new seller lead opportunities in submarkets near you. Try our free Google targeting tool here to find hidden pockets of more cost effective hyper-local leads near you.
Watch our on-demand lead gen webinar from July here where we discuss new trends for real estate teams and agents on Google Ads, including a deep dive on Google Local Service Ads (LSA's) for realtors.
Here are links to past historic Real Estate Seller Cost Per Lead Reports for Q1 2022, Q4 2021, Q3 2021, Q2 2021, Q1 2021.
.png)

.png?width=770&name=Q2%202022%20Google%20Seller%20Real%20Estate%20Lead%20Cost%20Report%20(600%20%C3%97%20350%20px).png)
