

.svg)

.png)


.png?width=770&height=433&name=2026%20Blog%20Featured%20Images%20(34).png)
Cost per lead tells you what you paid. The Lead Value Index tells you what you got for it.
CINC developed the Lead Value Index to give agents and brokers a clearer picture of advertising ROI. Rather than looking at CPL in isolation, the LVI factors in the median home sale price (NAR), average commission percentage, and the average rate at which leads close. The result is a single number that approximates how many dollars in commissions can be expected for every dollar invested in Google Buyer advertising. A higher LVI indicates that real estate leads are a better value. The formula is:
LVI = (the median home sales price ✖️ the average commission percentage ✖️ the average percent of leads that close) ➗ the total Google buyer CPL.]
The LVI improved in Q1 2026 compared to Q4 2025. Both Google Buyer CPL and average home sale prices fell during the quarter, but the drop in CPL was large enough to more than offset the decline in home prices, pushing the index higher overall.
The national LVI came in at 13.98 in Q1 2026, based on a median home price of $404,300 and a Google Buyer CPL of $7.23. An LVI of 13.98 means that $1 in ad spend is projected to generate approximately $13.98 in commissions. Note: markets with high LVIs offer the strongest mathematical return on advertising investment when campaigns are managed well.
There was not a lot of movement at the individual market level compared to last quarter. The rankings at the top remained largely stable. Among big markets, the top five were again led by three California metros: San Francisco, San Diego, and Los Angeles, with Boston and New York rounding out the group. When looking across all markets, Oxnard, CA took the top spot, followed by Urban Honolulu, HI and Pittsfield, MA.
Top 10 Lead Value Index Markets (All Markets, Q1 2026)
Oxnard-Ventura, CA leads all markets with an LVI of 45.77, by far the highest score in the country this quarter. Urban Honolulu follows at 38.84, and Pittsfield, MA rounds out the top three at 30.94. The top 10 is defined by markets with either very high median home prices, very low CPL, or both.
|
Rank |
Market |
LVI |
|
1 |
Oxnard-Thousand Oaks-Ventura, CA |
45.77 |
|
2 |
Urban Honolulu, HI |
38.84 |
|
3 |
Pittsfield, MA |
30.94 |
|
4 |
Naples-Immokalee-Marco Island, FL |
30.51 |
|
5 |
San Francisco-Oakland-Hayward, CA |
28.52 |
|
6 |
San Jose-Sunnyvale-Santa Clara, CA |
27.48 |
|
7 |
Kingston, NY |
26.53 |
|
8 |
Bridgeport-Stamford-Norwalk, CT |
24.55 |
|
9 |
San Diego-Carlsbad, CA |
22.85 |
|
10 |
Missoula, MT |
22.62 |
Note: LVI scores above 20 represent exceptional ad spend efficiency. Markets in this range typically combine relatively affordable CPL with high median home values, the two variables that most directly drive the index.
Top 10 Lead Value Index Big Markets (Q1 2026)
Among the 100 largest U.S. metro areas, San Francisco leads with an LVI of 28.52, followed by San Diego at 22.85 and New York at 21.57. Boston and Los Angeles round out the top five. All five of these markets benefit from high median home prices that produce strong projected returns even when CPL is elevated.
|
Rank |
Market |
LVI |
|
1 |
San Francisco-Oakland-Hayward, CA |
28.52 |
|
2 |
San Diego-Carlsbad, CA |
22.85 |
|
3 |
New York-Newark-Jersey City, NY-NJ-PA |
21.57 |
|
4 |
Boston-Cambridge-Newton, MA-NH |
20.48 |
|
5 |
Los Angeles-Long Beach-Anaheim, CA |
20.28 |
|
6 |
Miami-Fort Lauderdale-West Palm Beach, FL |
19.83 |
|
7 |
Seattle-Tacoma-Bellevue, WA |
17.63 |
|
8 |
Washington-Arlington-Alexandria, DC-VA-MD-WV |
16.55 |
|
9 |
Riverside-San Bernardino-Ontario, CA |
16.50 |
|
10 |
Philadelphia-Camden-Wilmington, PA-NJ-DE-MD |
15.63 |
Full Top 100 Markets: Q1 2026 Lead Value Index
Find your market. The tables below show CPL, median home price, and LVI for each of the top 100 U.S. markets by population. A few things worth noting before you scan:
- Oxnard-Ventura (rank 66) posts the highest LVI in the full top 100 at 45.77, driven by a $936,700 median home price and a $5.12 CPL.
- Providence, RI (rank 38) delivers an LVI of 20.78, one of the strongest scores of any market outside the top 25 by population.
- Virginia Beach (rank 37), Oklahoma City (rank 42), and Spokane (rank 100) sit at the bottom of the index, where CPL is high relative to local home values.
Markets Ranked 1-25
San Francisco (28.52) leads this group by a wide margin. New York (21.57), Boston (20.48), and Los Angeles (20.28) are the other markets exceeding an LVI of 20. At the bottom of the group, Pittsburgh (9.41), San Antonio (9.46), and Detroit (9.76) post the lowest scores.
|
Rank |
Market |
CPL |
Median Home Price |
LVI |
|
1 |
New York-Newark-Jersey City, NY-NJ-PA |
$8.73 |
$753,600 |
21.57 |
|
2 |
Los Angeles-Long Beach-Anaheim, CA |
$11.58 |
$939,700 |
20.28 |
|
3 |
Chicago-Naperville-Elgin, IL-IN-WI |
$6.73 |
$388,900 |
14.46 |
|
4 |
Dallas-Fort Worth-Arlington, TX |
$7.19 |
$366,600 |
12.76 |
|
5 |
Houston-The Woodlands-Sugar Land, TX |
$7.33 |
$337,200 |
11.50 |
|
6 |
Philadelphia-Camden-Wilmington, PA-NJ-DE-MD |
$6.27 |
$392,100 |
15.63 |
|
7 |
Washington-Arlington-Alexandria, DC-VA-MD-WV |
$9.69 |
$641,600 |
16.55 |
|
8 |
Miami-Fort Lauderdale-West Palm Beach, FL |
$8.01 |
$635,000 |
19.83 |
|
9 |
Atlanta-Sandy Springs-Roswell, GA |
$7.58 |
$372,000 |
12.27 |
|
10 |
Boston-Cambridge-Newton, MA-NH |
$9.25 |
$757,600 |
20.48 |
|
11 |
San Francisco-Oakland-Hayward, CA |
$11.44 |
$1,305,000 |
28.52 |
|
12 |
Riverside-San Bernardino-Ontario, CA |
$9.02 |
$595,000 |
16.50 |
|
13 |
Phoenix-Mesa-Scottsdale, AZ |
$9.13 |
$476,700 |
13.06 |
|
14 |
Detroit-Warren-Dearborn, MI |
$7.09 |
$276,700 |
9.76 |
|
15 |
Seattle-Tacoma-Bellevue, WA |
$10.93 |
$770,400 |
17.63 |
|
16 |
Minneapolis-St. Paul-Bloomington, MN-WI |
$8.82 |
$394,900 |
11.19 |
|
17 |
San Diego-Carlsbad, CA |
$10.88 |
$994,000 |
22.85 |
|
18 |
Tampa-St. Petersburg-Clearwater, FL |
$7.04 |
$400,000 |
14.20 |
|
19 |
St. Louis, MO-IL |
$6.22 |
$294,800 |
11.85 |
|
20 |
Baltimore-Columbia-Towson, MD |
$7.77 |
$426,000 |
13.70 |
|
21 |
Denver-Aurora-Lakewood, CO |
$12.16 |
$644,100 |
13.24 |
|
22 |
Pittsburgh, PA |
$6.30 |
$237,400 |
9.41 |
|
23 |
Charlotte-Concord-Gastonia, NC-SC |
$7.22 |
$427,600 |
14.81 |
|
24 |
Portland-Vancouver-Hillsboro, OR-WA |
$9.98 |
$589,700 |
14.78 |
|
25 |
San Antonio-New Braunfels, TX |
$8.36 |
$316,200 |
9.46 |
Lead Value Index: New York, NY (Q1 2026)
New York-Newark-Jersey City posts an LVI of 21.57, third among big markets. With a $753,600 median home price and a $8.73 CPL, New York delivers one of the strongest returns on Google Buyer ad spend of any large metro in the country. The high transaction value means each closed lead generates well above the national average in commissions.
Lead Value Index: Los Angeles, CA (Q1 2026)
Los Angeles-Long Beach-Anaheim comes in with an LVI of 20.28, fifth among big markets, anchored by a $939,700 median home price. LA's relatively modest CPL increase this quarter helped sustain a strong LVI heading into spring.
Lead Value Index: Philadelphia, PA (Q1 2026)
Philadelphia-Camden-Wilmington delivers an LVI of 15.63, tenth among big markets. With one of the lowest CPLs of any large metro at $6.27 and a $392,100 median home price, Philadelphia continues to offer a genuinely favorable cost-to-value ratio for agents running buyer campaigns.
Lead Value Index: Washington, DC (Q1 2026)
Washington-Arlington-Alexandria posts an LVI of 16.55, eighth among big markets, driven by a $641,600 median home price. Even with a $9.69 CPL, the region's strong home values keep projected returns well above the national benchmark.
Lead Value Index: Miami, FL (Q1 2026)
Miami-Fort Lauderdale-West Palm Beach comes in at an LVI of 19.83, sixth among big markets, supported by a $635,000 median home price. South Florida's sustained demand from relocation and international buyers keeps home values elevated, which translates directly into strong LVI performance.
Lead Value Index: Boston, MA (Q1 2026)
Boston-Cambridge-Newton posts the fourth-highest LVI among big markets at 20.48, anchored by a $757,600 median home price and a $9.25 CPL. Boston combines high home values with a relatively manageable cost to acquire leads, making it one of the stronger value propositions in the country for Google Buyer ad spend.
Lead Value Index: San Francisco, CA (Q1 2026)
San Francisco-Oakland-Hayward leads all big markets with an LVI of 28.52. The $1,305,000 median home price is the primary driver, and even with an $11.44 CPL, every dollar in ad spend projects to generate over $28 in gross commissions. For agents and teams with strong follow-up systems, the Bay Area remains one of the highest-ceiling markets in the country for Google Buyer ROI.
Lead Value Index: San Diego, CA (Q1 2026)
San Diego-Carlsbad posts an LVI of 22.85, second among big markets, driven by a $994,000 median home price. San Diego is one of only three large markets to exceed an LVI of 20, putting it in the top tier for expected return on Google Buyer ad spend.
Lead Value Index: Seattle, WA (Q1 2026)
Seattle-Tacoma-Bellevue delivers an LVI of 17.63, seventh among big markets, on the strength of a $770,400 median home price. Despite a $10.93 CPL, Seattle's home values are strong enough to keep the LVI well above the national benchmark of 13.98.
Lead Value Index: Tampa, FL (Q1 2026)
Tampa-St. Petersburg-Clearwater posts an LVI of 14.20, just above the national average, on a $7.04 CPL that is among the lowest of any big market. Tampa's CPL efficiency helps offset its more modest home values, keeping the return on ad spend competitive with larger and more expensive markets.
Lead Value Index: Charlotte, NC (Q1 2026)
Charlotte-Concord-Gastonia posts an LVI of 14.81, slightly above the national average, with a $427,600 median home price and a $7.22 CPL. Charlotte is one of the more efficient mid-size markets for Google Buyer investment in the Southeast, and its continued population growth keeps the buyer pool deep.
Lead Value Index: Denver, CO (Q1 2026)
Denver-Aurora-Lakewood comes in at an LVI of 13.24, close to the national average, despite a $644,100 median home price. The relatively high CPL of $12.16 limits the index, making Denver one of the clearer examples of how a high home price alone does not guarantee strong LVI performance without cost efficiency on the ad spend side.
Markets Ranked 26-50
San Jose (rank 34) is the standout at 27.48, driven by a $1,920,000 median home price. Providence (rank 38) posts 20.78, one of the strongest scores of any market outside the top 25. Virginia Beach (rank 37) at 8.53 and Oklahoma City (rank 42) at 8.14 post the lowest LVIs in this group.
|
Rank |
Market |
CPL |
Median Home Price |
LVI |
|
26 |
Orlando-Kissimmee-Sanford, FL |
$6.46 |
$440,500 |
17.05 |
|
27 |
Sacramento-Roseville-Arden-Arcade, CA |
$9.97 |
$539,000 |
13.52 |
|
28 |
Cincinnati, OH-KY-IN |
$5.20 |
$314,900 |
15.15 |
|
29 |
Cleveland-Elyria, OH |
$6.62 |
$236,900 |
8.95 |
|
30 |
Kansas City, MO-KS |
$6.70 |
$350,700 |
13.08 |
|
31 |
Las Vegas-Henderson-Paradise, NV |
$11.39 |
$480,700 |
10.55 |
|
32 |
Columbus, OH |
$8.08 |
$336,300 |
10.41 |
|
33 |
Indianapolis-Carmel-Anderson, IN |
$7.27 |
$330,600 |
11.37 |
|
34 |
San Jose-Sunnyvale-Santa Clara, CA |
$17.47 |
$1,920,000 |
27.48 |
|
35 |
Austin-Round Rock, TX |
$8.87 |
$465,100 |
13.11 |
|
36 |
Nashville-Davidson-Murfreesboro-Franklin, TN |
$9.48 |
$421,300 |
11.11 |
|
37 |
Virginia Beach-Norfolk-Newport News, VA-NC |
$10.78 |
$367,500 |
8.53 |
|
38 |
Providence-Warwick, RI-MA |
$6.46 |
$536,800 |
20.78 |
|
39 |
Milwaukee-Waukesha-West Allis, WI |
$7.14 |
$417,500 |
14.62 |
|
40 |
Jacksonville, FL |
$7.01 |
$390,700 |
13.94 |
|
41 |
Memphis, TN-MS-AR |
$5.06 |
$291,600 |
14.40 |
|
42 |
Oklahoma City, OK |
$8.14 |
$265,000 |
8.14 |
|
43 |
Louisville/Jefferson County, KY-IN |
$5.38 |
$294,700 |
13.68 |
|
44 |
Richmond, VA |
$8.10 |
$448,200 |
13.84 |
|
45 |
New Orleans-Metairie, LA |
$4.18 |
$292,800 |
17.52 |
|
46 |
Hartford-West Hartford-East Hartford, CT |
$7.15 |
$411,400 |
14.39 |
|
47 |
Raleigh, NC |
$8.36 |
$452,500 |
13.53 |
|
48 |
Birmingham-Hoover, AL |
$5.49 |
$321,300 |
14.64 |
|
49 |
Buffalo-Cheektowaga-Niagara Falls, NY |
$5.12 |
$286,100 |
13.98 |
|
50 |
Salt Lake City, UT |
$11.09 |
$596,300 |
13.44 |
Lead Value Index: San Jose, CA (Q1 2026)
San Jose-Sunnyvale-Santa Clara posts an LVI of 27.48, the strongest of any market ranked 26-50 by population. The $1,920,000 median home price is the highest of any market in the full top 100. Even with a $17.47 CPL, the potential commission per transaction is unmatched. Agents operating in the South Bay need strong conversion systems to justify the acquisition cost, but the upside is significant.
Lead Value Index: Providence, RI (Q1 2026)
Providence-Warwick delivers an LVI of 20.78, one of the strongest scores of any market outside the top 25 by population. A $536,800 median home price and a modest $6.46 CPL create a favorable combination that puts Providence well above the national average and ahead of several larger markets.
Lead Value Index: Orlando, FL (Q1 2026)
Orlando-Kissimmee-Sanford posts an LVI of 17.05, well above the national average, supported by a $440,500 median home price and a $6.46 CPL that declined quarter over quarter. Orlando's combination of improving cost efficiency and active buyer demand makes it one of the more attractive mid-size markets for Google Buyer ROI heading into the second half of the year.
Lead Value Index: New Orleans, LA (Q1 2026)
New Orleans-Metairie delivers an LVI of 17.52, aided by the lowest CPL of any market in the 26-50 group at $4.18. While the $292,800 median home price is below average, the very low acquisition cost keeps the return on investment well above the national benchmark.
Lead Value Index: Milwaukee, WI (Q1 2026)
Milwaukee-Waukesha-West Allis posts an LVI of 14.62, above the national average, with a $417,500 median home price and a $7.14 CPL. Milwaukee is one of the more underappreciated markets for Google Buyer ROI in the Midwest, consistently delivering above-average returns without the elevated costs of larger metros.
Markets Ranked 51-75
Oxnard-Ventura (rank 66) posts the highest LVI in this group and in the entire top 100 at 45.77. Urban Honolulu (rank 54) follows at 38.84 and Bridgeport-Stamford (rank 57) delivers 24.55. Bakersfield (10.30), Albuquerque (10.37), and Dayton (9.17) post the lowest scores in this group.
|
Rank |
Market |
CPL |
Median Home Price |
LVI |
|
51 |
Rochester, NY |
$4.67 |
$269,100 |
14.41 |
|
52 |
Grand Rapids-Wyoming, MI |
$8.77 |
$334,800 |
9.55 |
|
53 |
Tucson, AZ |
$8.79 |
$382,000 |
10.87 |
|
54 |
Urban Honolulu, HI |
$7.35 |
$1,142,100 |
38.84 |
|
55 |
Tulsa, OK |
$6.50 |
$277,700 |
10.69 |
|
56 |
Fresno, CA |
$5.96 |
$430,000 |
18.02 |
|
57 |
Bridgeport-Stamford-Norwalk, CT |
$7.61 |
$747,500 |
24.55 |
|
58 |
Worcester, MA-CT |
$6.83 |
$465,200 |
17.02 |
|
59 |
Albuquerque, NM |
$9.08 |
$376,600 |
10.37 |
|
60 |
Omaha-Council Bluffs, NE-IA |
$5.48 |
$310,700 |
14.17 |
|
61 |
Albany-Schenectady-Troy, NY |
$5.08 |
$342,500 |
16.84 |
|
62 |
New Haven-Milford, CT |
$7.06 |
$419,100 |
14.85 |
|
63 |
Bakersfield, CA |
$9.51 |
$391,800 |
10.30 |
|
64 |
Knoxville, TN |
$7.26 |
$365,100 |
12.57 |
|
65 |
Greenville-Anderson-Mauldin, SC |
$6.50 |
$345,300 |
13.28 |
|
66 |
Oxnard-Thousand Oaks-Ventura, CA |
$5.12 |
$936,700 |
45.77 |
|
67 |
El Paso, TX |
$4.10 |
$274,200 |
16.71 |
|
68 |
Allentown-Bethlehem-Easton, PA-NJ |
$6.23 |
$366,400 |
14.71 |
|
69 |
Baton Rouge, LA |
$4.81 |
$267,900 |
13.93 |
|
70 |
McAllen-Edinburg-Mission, TX |
$4.78 |
N/A |
N/A |
|
71 |
Dayton, OH |
$7.26 |
$266,500 |
9.17 |
|
72 |
Columbia, SC |
$6.50 |
$280,600 |
10.79 |
|
73 |
Greensboro-High Point, NC |
$6.47 |
$299,700 |
11.58 |
|
74 |
North Port-Sarasota-Bradenton, FL |
$8.10 |
$479,000 |
14.78 |
|
75 |
Little Rock-North Little Rock-Conway, AR |
$4.98 |
$226,400 |
11.38 |
Lead Value Index: Oxnard-Ventura, CA (Q1 2026)
Oxnard-Thousand Oaks-Ventura posts the highest LVI in the entire top 100 at 45.77. A $936,700 median home price combined with a $5.12 CPL, one of the lowest in California, creates an exceptional return profile. For agents operating in Ventura County, Google Buyer leads represent one of the highest-ROI advertising channels available anywhere in the country.
Lead Value Index: Honolulu, HI (Q1 2026)
Urban Honolulu posts an LVI of 38.84, second overall, anchored by a $1,142,100 median home price. The $7.35 CPL is moderate given the home values, and the resulting return on ad spend is among the strongest in the full top 100. Agents here should focus on conversion systems to fully capture the value the LVI suggests is available.
Lead Value Index: Bridgeport-Stamford, CT (Q1 2026)
Bridgeport-Stamford-Norwalk posts an LVI of 24.55, one of the top ten overall. A $747,500 median home price and a $7.61 CPL make Fairfield County one of the most efficient markets in the country for Google Buyer ad spend among non-California markets. Agents here benefit from high transaction values without the extreme CPL that often accompanies them in coastal California.
Lead Value Index: Fresno, CA (Q1 2026)
Fresno posts an LVI of 18.02, well above the national average, aided by a $430,000 median home price and a $5.96 CPL. Fresno is a mid-size California market that punches above its weight in LVI terms, offering agents access to California home values without the premium CPL of the state's coastal metros.
Lead Value Index: El Paso, TX (Q1 2026)
El Paso delivers an LVI of 16.71 on the lowest CPL in the entire top 100 at $4.10. The $274,200 median home price is modest, but the rock-bottom acquisition cost drives returns well above the national benchmark. El Paso is a strong option for agents looking to generate high lead volume at low cost.
Markets Ranked 76-100
Cape Coral-Fort Myers (15.06) and Syracuse (14.18) lead this group on LVI. Spokane (7.45) and Harrisburg (9.31) post the lowest scores, where higher CPL relative to home values limits return on ad spend.
|
Rank |
Market |
CPL |
Median Home Price |
LVI |
|
76 |
Stockton-Lodi, CA |
N/A |
N/A |
N/A |
|
77 |
Akron, OH |
$5.72 |
$225,500 |
9.86 |
|
78 |
Charleston-North Charleston, SC |
$10.74 |
$453,300 |
10.55 |
|
79 |
Colorado Springs, CO |
$9.12 |
$456,200 |
12.50 |
|
80 |
Syracuse, NY |
$4.59 |
$260,400 |
14.18 |
|
81 |
Winston-Salem, NC |
$6.36 |
$318,700 |
12.53 |
|
82 |
Cape Coral-Fort Myers, FL |
$6.39 |
$385,000 |
15.06 |
|
83 |
Boise City, ID |
$9.28 |
$489,000 |
13.17 |
|
84 |
Wichita, KS |
N/A |
$230,900 |
N/A |
|
85 |
Springfield, MA |
$8.12 |
$374,900 |
11.54 |
|
86 |
Madison, WI |
$9.26 |
$458,300 |
12.37 |
|
87 |
Lakeland-Winter Haven, FL |
$5.93 |
$320,000 |
13.48 |
|
88 |
Ogden-Clearfield, UT |
$10.23 |
$490,900 |
11.99 |
|
89 |
Toledo, OH |
$5.28 |
$195,100 |
9.23 |
|
90 |
Deltona-Daytona Beach-Ormond Beach, FL |
$6.53 |
$355,000 |
13.58 |
|
91 |
Des Moines-West Des Moines, IA |
$6.58 |
$307,400 |
11.67 |
|
92 |
Jackson, MS |
$6.01 |
$257,500 |
10.72 |
|
93 |
Augusta-Richmond County, GA-SC |
$4.39 |
N/A |
N/A |
|
94 |
Scranton-Wilkes-Barre-Hazleton, PA |
N/A |
N/A |
N/A |
|
95 |
Youngstown-Warren-Boardman, OH-PA |
N/A |
$177,400 |
N/A |
|
96 |
Harrisburg-Carlisle, PA |
$7.60 |
$283,200 |
9.31 |
|
97 |
Provo-Orem, UT |
$10.26 |
$538,900 |
13.13 |
|
98 |
Palm Bay-Melbourne-Titusville, FL |
$6.57 |
$365,000 |
13.89 |
|
99 |
Chattanooga, TN-GA |
$6.53 |
$346,400 |
13.27 |
|
100 |
Spokane-Spokane Valley, WA |
$14.27 |
$425,100 |
7.45 |
Lead Value Index: Cape Coral-Fort Myers, FL (Q1 2026)
Cape Coral-Fort Myers posts an LVI of 15.06, the highest in the 76-100 group, on a $6.39 CPL that fell 12% from Q4. Southwest Florida's improving cost profile combined with a $385,000 median home price makes it one of the better-value markets in Florida for Google Buyer ad spend right now.
Lead Value Index: Colorado Springs, CO (Q1 2026)
Colorado Springs posts an LVI of 12.50, just below the national average, with a $456,200 median home price and a $9.12 CPL. The CPL declined from Q4, which nudged the LVI upward. Colorado Springs is a steady, mid-tier performer that tends to offer predictable returns for agents who run consistent campaigns.
Lead Value Index: Spokane, WA (Q1 2026)
Spokane-Spokane Valley posts the lowest LVI in the full top 100 at 7.45. A $14.27 CPL, the highest of any market in the 76-100 group, combined with a $425,100 median home price produces a return profile that warrants careful evaluation. Agents running Google Buyer campaigns in Spokane should review their cost-per-acquisition closely against actual commission income to confirm campaigns remain profitable.
Lead Value Index: Boise, ID (Q1 2026)
Boise City posts an LVI of 13.17, just below the national average, with a $489,000 median home price and a $9.28 CPL that declined from Q4. Boise's improving cost efficiency is a positive signal, and if that trend continues into Q2, the market's LVI should move closer to the national benchmark.
What the LVI Means for Your Q2 and Q3 Ad Spend
The LVI improvement in Q1 reflects exactly what happens when CPL drops: the same dollar in ad spend buys more opportunity. As CPL moves upward through Q2 and into Q3, the LVI will likely moderate. That is not a reason to pull back, but it is a reason to be deliberate about where and how you are spending.
Markets with consistently high LVIs, particularly coastal California, the Northeast, and South Florida, tend to sustain strong returns even as costs rise because home values provide a natural cushion. Markets where the LVI is already low heading into a higher-cost quarter warrant closer attention to campaign efficiency.
If you would like to know more about the Lead Value Index, or find out the LVI of your market, please register on cincpro.com to speak with a CINC product expert.
Despite market conditions, the ROI of online real estate advertising for real estate teams and agents continued to be exceptionally strong (for more details on related trends, see our recent Google buyer lead cost report and the seller lead cost report).
CINC is the leader in online real estate lead generation with more than 50,000 clients. This behind-the-scenes lead cost data is what we were seeing for our portfolio of real estate team and agent clients during Q4 2025. The CINC client marketing team manages almost $30 million in search and social advertising spend annually for real estate teams and agents across the United States and Canada. If you want to see how CINC can help you find more higher quality hyperlocal real estate leads on Google, request a demo here.
Additional Google Real Estate Lead Gen Resources from CINC:
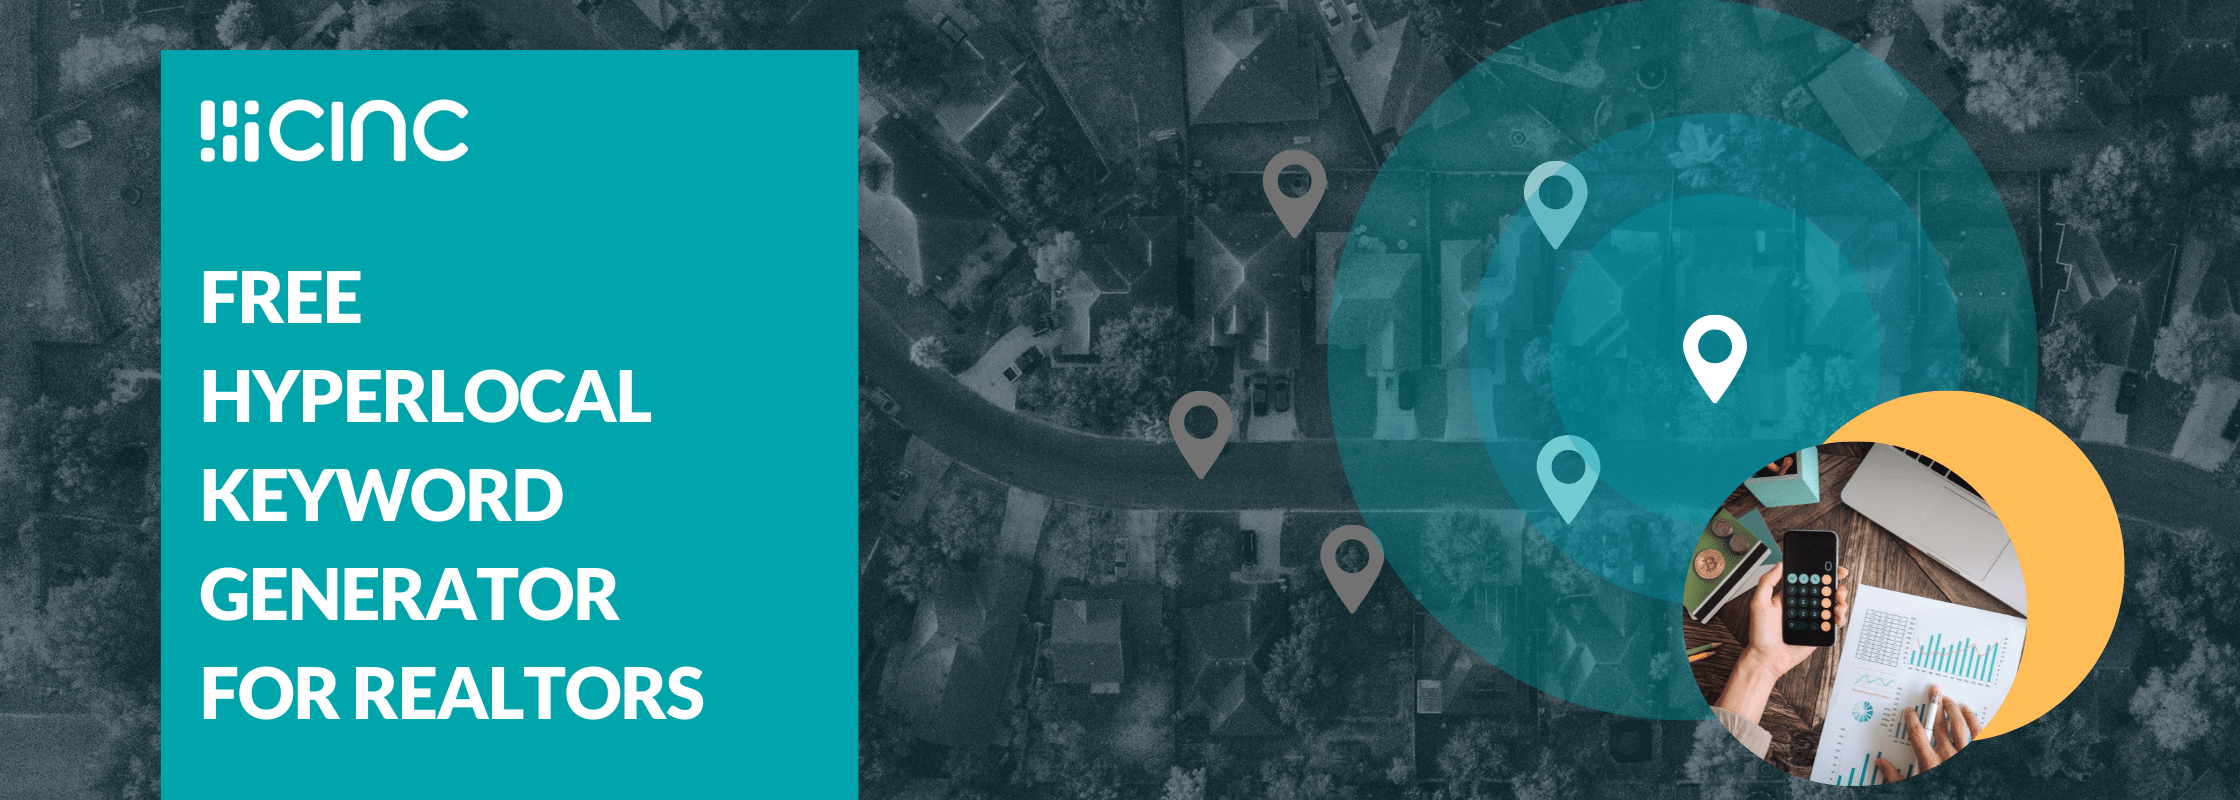
With buyer cost per lead up recently, it is more important than ever to be more efficient paying for leads on Google. Try our free local Google real estate targeting tool here to find hidden pockets of more cost effective hyper-local leads near you.
.png?width=2240&height=800&name=Secret%20Submarket%20Finder%20Tool%20(1).png)
Here are links to past historic Google Real Estate Lead Value Index Reports for Q4 2025, Q3 2025, Q2 2025, Q1 2025, Q4 2024, Q3 2024, Q2 2024, Q1 2024, Q4 2023, Q3 2024, Q2 2023, Q1 2023, Q4 2022, Q3 2022, Q2 2022, Q1 2022, Q4 2021.