

.svg)

.png)


%20(5)-1.png?width=770&height=434&name=Q2%202023%20Google%20Seller%20Real%20Estate%20Lead%20Cost%20Report%20(600%20%C3%97%20350%20px)%20(5)-1.png)
Q4 is historically the peak quarter for seller lead costs, and 2025 followed that pattern with a modest year-over-year increase.
The overall Google Seller CPL in CINC's portfolio came in at $17.40 in Q4 2025, a 22% increase versus the same period in 2024. Importantly, a meaningful portion of that increase reflects a deliberate shift in CINC's campaign strategy toward higher-quality seller leads, not simply market-driven inflation. Paying a bit more for a seller lead that is more likely to convert is a trade-off that benefits agents and teams over the long run.
Detroit repeated as the most affordable large market for seller leads. Among all markets, Modesto, CA, Louisville, KY, and Ocala, FL led the way with the lowest CPLs in the country.
As with buyer leads, expect seller CPL to ease in Q1 2026 as holiday ad competition fades and a new campaign cycle begins.
What This Means for Your Budget: Seller leads cost more than buyer leads, but a single listing typically generates far more revenue per transaction. Q1 2026 is historically the most cost-efficient quarter to invest in Google Seller ads. Agents who get their seller campaigns running before spring inventory season will be best positioned to capture listing appointments at the lowest possible acquisition cost.
Top 10 Lowest CPL Seller Markets in the U.S. (Q4 2025)
The most affordable Google Seller lead markets in the country this quarter. Modesto, CA took the top spot with a $7.09 CPL, followed by Louisville and Ocala. These markets offer a rare combination of low acquisition cost and active seller inventory.
|
Rank |
Market |
CPL |
|
1 |
Modesto, CA |
$7.09 |
|
2 |
Louisville/Jefferson County, KY-IN |
$7.58 |
|
3 |
Ocala, FL |
$8.21 |
|
4 |
Bangor, ME |
$8.22 |
|
5 |
Akron, OH |
$8.63 |
|
6 |
Winston-Salem, NC |
$8.66 |
|
7 |
Detroit-Warren-Dearborn, MI |
$8.86 |
|
8 |
Bellingham, WA |
$9.58 |
|
9 |
Birmingham-Hoover, AL |
$9.77 |
|
10 |
Lakeland-Winter Haven, FL |
$9.87 |
Note: Seller leads in smaller and mid-size markets often perform well because there is less advertiser competition. Agents willing to work hyperlocal campaigns can find significant value in these markets.
Top 10 Lowest CPL Big Markets for Seller Leads (Q4 2025)
The most affordable seller lead markets among the 100 largest U.S. metro areas. Detroit held the top spot for the second consecutive quarter at $8.86 CPL, followed by Dallas and Chicago. All three are meaningful outliers in a big-market landscape where seller CPL frequently exceeds $15.
|
Rank |
Market |
CPL |
|
1 |
Detroit-Warren-Dearborn, MI |
$8.86 |
|
2 |
Dallas-Fort Worth-Arlington, TX |
$11.74 |
|
3 |
Chicago-Naperville-Elgin, IL-IN-WI |
$12.88 |
|
4 |
Baltimore-Columbia-Towson, MD |
$13.80 |
|
5 |
New York-Newark-Jersey City, NY-NJ-PA |
$14.77 |
|
6 |
Philadelphia-Camden-Wilmington, PA-NJ-DE-MD |
$14.81 |
|
7 |
Seattle-Tacoma-Bellevue, WA |
$14.95 |
|
8 |
Tampa-St. Petersburg-Clearwater, FL |
$15.31 |
|
9 |
Atlanta-Sandy Springs-Roswell, GA |
$15.42 |
|
10 |
Minneapolis-St. Paul-Bloomington, MN-WI |
$17.01 |
Full Top 100 Markets: Q4 2025 Seller CPL and Year-Over-Year Change
Find your market. See what changed. A note on the data: seller lead campaigns are not active in every market in CINC's portfolio. Markets showing N/A either had insufficient volume for a reliable CPL figure or were not running seller-specific campaigns in Q4 2025. A few standouts worth noting before you scan the tables:
- Los Angeles and Philadelphia both saw seller CPL decrease year over year, down 34% and 29% respectively.
- Nashville saw the largest increase among markets ranked 26-50, up 111% year over year.
- Chattanooga, TN posted the largest decrease in the bottom half of the list, falling 39%.
Markets Ranked 1-25
|
Rank |
Market |
CPL |
YoY Change |
|
1 |
New York-Newark-Jersey City, NY-NJ-PA |
$14.77 |
+42% |
|
2 |
Los Angeles-Long Beach-Anaheim, CA |
$19.23 |
-34% |
|
3 |
Chicago-Naperville-Elgin, IL-IN-WI |
$12.88 |
+58% |
|
4 |
Dallas-Fort Worth-Arlington, TX |
$11.74 |
+17% |
|
5 |
Houston-The Woodlands-Sugar Land, TX |
N/A |
N/A |
|
6 |
Philadelphia-Camden-Wilmington, PA-NJ-DE-MD |
$14.81 |
-29% |
|
7 |
Washington-Arlington-Alexandria, DC-VA-MD-WV |
$19.23 |
+4% |
|
8 |
Miami-Fort Lauderdale-West Palm Beach, FL |
$19.27 |
+28% |
|
9 |
Atlanta-Sandy Springs-Roswell, GA |
$15.42 |
+56% |
|
10 |
Boston-Cambridge-Newton, MA-NH |
N/A |
N/A |
|
11 |
San Francisco-Oakland-Hayward, CA |
$21.90 |
+86% |
|
12 |
Riverside-San Bernardino-Ontario, CA |
$24.32 |
+58% |
|
13 |
Phoenix-Mesa-Scottsdale, AZ |
$26.28 |
+30% |
|
14 |
Detroit-Warren-Dearborn, MI |
$8.86 |
+15% |
|
15 |
Seattle-Tacoma-Bellevue, WA |
$14.95 |
0% |
|
16 |
Minneapolis-St. Paul-Bloomington, MN-WI |
$17.01 |
-35% |
|
17 |
San Diego-Carlsbad, CA |
$20.38 |
N/A |
|
18 |
Tampa-St. Petersburg-Clearwater, FL |
$15.31 |
+44% |
|
19 |
St. Louis, MO-IL |
N/A |
N/A |
|
20 |
Baltimore-Columbia-Towson, MD |
$13.80 |
-11% |
|
21 |
Denver-Aurora-Lakewood, CO |
N/A |
N/A |
|
22 |
Pittsburgh, PA |
N/A |
N/A |
|
23 |
Charlotte-Concord-Gastonia, NC-SC |
$13.76 |
+66% |
|
24 |
Portland-Vancouver-Hillsboro, OR-WA |
$14.45 |
+96% |
|
25 |
San Antonio-New Braunfels, TX |
N/A |
N/A |
Google Seller Lead Costs in New York, NY (Q4 2025)
New York-Newark-Jersey City came in at $14.77 CPL for seller leads, up 42% year over year. Despite the increase, New York remains one of the more affordable large coastal markets for sellers relative to the average transaction value, where a single listing commission can justify dozens of acquired leads.
Google Seller Lead Costs in Los Angeles, CA (Q4 2025)
Los Angeles-Long Beach-Anaheim posted $19.23 CPL, a 34% decrease year over year. LA is one of the few major markets where seller lead costs moved in a positive direction in Q4 2025, making it a better time to invest in seller campaigns there than it has been in recent quarters.
Google Seller Lead Costs in Chicago, IL (Q4 2025)
Chicago-Naperville-Elgin came in at $12.88 CPL, up 58% year over year. Chicago ranks third among big markets for seller lead affordability, but agents should budget for continued cost increases heading into 2026 given the pace of year-over-year growth.
Google Seller Lead Costs in Dallas-Fort Worth, TX (Q4 2025)
Dallas-Fort Worth-Arlington posted $11.74 CPL, up 17% year over year, and ranks second among big markets for seller lead affordability. DFW's combination of active inventory, population growth, and relatively low lead costs makes it one of the stronger markets for seller lead ROI in the country.
Google Seller Lead Costs in Philadelphia, PA (Q4 2025)
Philadelphia-Camden-Wilmington came in at $14.81 CPL, down 29% year over year. Philadelphia joins Los Angeles as one of the notable large markets where seller lead costs declined in Q4, offering agents there a meaningful cost advantage compared to a year ago.
Google Seller Lead Costs in Washington, DC (Q4 2025)
The Washington-Arlington-Alexandria metro posted $19.23 CPL, up just 4% year over year. DC is one of the steadier large markets for seller lead costs, with modest annual movement that makes budget forecasting more predictable for agents and teams.
Google Seller Lead Costs in Miami, FL (Q4 2025)
Miami-Fort Lauderdale-West Palm Beach came in at $19.27 CPL, up 28% year over year. South Florida's continued appeal as a relocation and second-home market drives strong competition for seller leads, keeping acquisition costs elevated.
Google Seller Lead Costs in Atlanta, GA (Q4 2025)
Atlanta-Sandy Springs-Roswell posted $15.42 CPL, up 56% year over year. Atlanta's rapid growth as a relocation hub continues to push advertiser competition higher. Teams running seller campaigns in Atlanta should review their targeting and bidding strategies to ensure spend efficiency.
Google Seller Lead Costs in San Francisco, CA (Q4 2025)
San Francisco-Oakland-Hayward came in at $21.90 CPL, up 86% year over year. The Bay Area remains one of the most expensive seller lead markets in the country, though the high average home value means the math can still work well for teams with strong listing conversion rates.
Google Seller Lead Costs in Seattle, WA (Q4 2025)
Seattle-Tacoma-Bellevue posted $14.95 CPL with no year-over-year change. Seattle's flat cost profile is notable in a quarter where most markets saw increases, and it ranks seventh among big markets for seller lead affordability.
Google Seller Lead Costs in Detroit, MI (Q4 2025)
Detroit-Warren-Dearborn is the standout performer among large markets, posting the lowest seller CPL of any big metro at $8.86, up just 15% year over year. For agents and teams operating in the Detroit metro, seller leads on Google represent one of the best cost-to-opportunity ratios of any major market in the country.
Google Seller Lead Costs in Tampa, FL (Q4 2025)
Tampa-St. Petersburg-Clearwater came in at $15.31 CPL, up 44% year over year. Tampa's strong in-migration and active resale market continue to attract advertiser competition, pushing seller lead costs higher. The market remains viable but warrants careful budget management.
Google Seller Lead Costs in Baltimore, MD (Q4 2025)
Baltimore-Columbia-Towson posted $13.80 CPL, down 11% year over year, and ranks fourth among big markets for seller lead affordability. Baltimore is one of the few large markets where costs actually improved, making it a favorable environment for expanding seller ad spend.
Google Seller Lead Costs in Charlotte, NC (Q4 2025)
Charlotte-Concord-Gastonia came in at $13.76 CPL, up 66% year over year. Despite the sharp increase, Charlotte's seller CPL remains below many comparable growth markets. The strong population growth driving Charlotte's housing market also means a healthy supply of potential sellers.
Google Seller Lead Costs in Portland, OR (Q4 2025)
Portland-Vancouver-Hillsboro posted $14.45 CPL, up 96% year over year. Portland's near-doubling of seller lead costs is the steepest increase among markets ranked 1-25 and warrants close attention from agents running campaigns there.
Markets Ranked 26-50
Nashville saw seller CPL more than double year over year (+111%), the largest increase in this group. Louisville, KY remains one of the best value markets in the country at $7.58.
|
Rank |
Market |
CPL |
YoY Change |
|
26 |
Orlando-Kissimmee-Sanford, FL |
$17.48 |
+55% |
|
27 |
Sacramento-Roseville-Arden-Arcade, CA |
N/A |
N/A |
|
28 |
Cincinnati, OH-KY-IN |
N/A |
N/A |
|
29 |
Cleveland-Elyria, OH |
N/A |
N/A |
|
30 |
Kansas City, MO-KS |
N/A |
N/A |
|
31 |
Las Vegas-Henderson-Paradise, NV |
$19.42 |
+47% |
|
32 |
Columbus, OH |
N/A |
N/A |
|
33 |
Indianapolis-Carmel-Anderson, IN |
N/A |
N/A |
|
34 |
San Jose-Sunnyvale-Santa Clara, CA |
N/A |
N/A |
|
35 |
Austin-Round Rock, TX |
N/A |
N/A |
|
36 |
Nashville-Davidson-Murfreesboro-Franklin, TN |
$18.20 |
+111% |
|
37 |
Virginia Beach-Norfolk-Newport News, VA-NC |
N/A |
N/A |
|
38 |
Providence-Warwick, RI-MA |
N/A |
N/A |
|
39 |
Milwaukee-Waukesha-West Allis, WI |
N/A |
N/A |
|
40 |
Jacksonville, FL |
N/A |
N/A |
|
41 |
Memphis, TN-MS-AR |
N/A |
N/A |
|
42 |
Oklahoma City, OK |
N/A |
N/A |
|
43 |
Louisville/Jefferson County, KY-IN |
$7.58 |
+36% |
|
44 |
Richmond, VA |
N/A |
N/A |
|
45 |
New Orleans-Metairie, LA |
N/A |
N/A |
|
46 |
Hartford-West Hartford-East Hartford, CT |
$17.40 |
+93% |
|
47 |
Raleigh, NC |
$11.07 |
+28% |
|
48 |
Birmingham-Hoover, AL |
$9.77 |
N/A |
|
49 |
Buffalo-Cheektowaga-Niagara Falls, NY |
$11.89 |
N/A |
|
50 |
Salt Lake City, UT |
N/A |
N/A |
Google Seller Lead Costs in Orlando, FL (Q4 2025)
Orlando-Kissimmee-Sanford posted $17.48 CPL, up 55% year over year. As Florida's tourist-driven market continues to attract new residents, seller lead competition has intensified. Agents here benefit from a steady pool of relocating sellers but should account for rising acquisition costs.
Google Seller Lead Costs in Las Vegas, NV (Q4 2025)
Las Vegas-Henderson-Paradise came in at $19.42 CPL, up 47% year over year. Las Vegas continues to see strong activity from investors and relocating sellers, keeping demand and lead costs elevated. Teams with systems built for high-velocity lead follow-up are best positioned in this market.
Google Seller Lead Costs in Nashville, TN (Q4 2025)
Nashville-Davidson-Murfreesboro-Franklin posted $18.20 CPL, more than doubling year over year at +111%. Nashville's ongoing status as one of the country's most active relocation markets has intensified advertiser competition for seller leads significantly. Budget planning for 2026 should reflect this new cost baseline.
Google Seller Lead Costs in Louisville, KY (Q4 2025)
Louisville-Jefferson County came in at $7.58 CPL, ranking second overall for the lowest seller lead costs in the entire top 100. Despite a 36% year-over-year increase, Louisville remains one of the best value markets in the country for agents looking to build a listing pipeline at a manageable cost.
Google Seller Lead Costs in Raleigh, NC (Q4 2025)
Raleigh posted $11.07 CPL, up 28% year over year. Raleigh's technology-driven growth and strong relocation activity make it an attractive market for seller lead investment, and the CPL remains reasonable relative to the area's average home values.
Markets Ranked 51-75
Urban Honolulu, HI had the highest seller CPL in this group at $31.25, up 182% year over year. Bridgeport-Stamford, CT (+134%) and Albuquerque, NM (+119%) also saw sharp increases.
|
Rank |
Market |
CPL |
YoY Change |
|
51 |
Rochester, NY |
N/A |
N/A |
|
52 |
Grand Rapids-Wyoming, MI |
N/A |
N/A |
|
53 |
Tucson, AZ |
$19.76 |
+9% |
|
54 |
Urban Honolulu, HI |
$31.25 |
+182% |
|
55 |
Tulsa, OK |
N/A |
N/A |
|
56 |
Fresno, CA |
N/A |
N/A |
|
57 |
Bridgeport-Stamford-Norwalk, CT |
$24.85 |
+134% |
|
58 |
Worcester, MA-CT |
N/A |
N/A |
|
59 |
Albuquerque, NM |
$19.92 |
+119% |
|
60 |
Omaha-Council Bluffs, NE-IA |
N/A |
N/A |
|
61 |
Albany-Schenectady-Troy, NY |
$17.22 |
+110% |
|
62 |
New Haven-Milford, CT |
N/A |
N/A |
|
63 |
Bakersfield, CA |
$14.29 |
+76% |
|
64 |
Knoxville, TN |
N/A |
N/A |
|
65 |
Greenville-Anderson-Mauldin, SC |
N/A |
N/A |
|
66 |
Oxnard-Thousand Oaks-Ventura, CA |
N/A |
N/A |
|
67 |
El Paso, TX |
N/A |
N/A |
|
68 |
Allentown-Bethlehem-Easton, PA-NJ |
N/A |
N/A |
|
69 |
Baton Rouge, LA |
N/A |
N/A |
|
70 |
McAllen-Edinburg-Mission, TX |
N/A |
N/A |
|
71 |
Dayton, OH |
N/A |
N/A |
|
72 |
Columbia, SC |
N/A |
N/A |
|
73 |
Greensboro-High Point, NC |
N/A |
N/A |
|
74 |
North Port-Sarasota-Bradenton, FL |
$21.00 |
-8% |
|
75 |
Little Rock-North Little Rock-Conway, AR |
N/A |
N/A |
Google Seller Lead Costs in Honolulu, HI (Q4 2025)
Urban Honolulu came in at $31.25 CPL, up 182% year over year, the highest CPL of any market in the 51-75 group. Honolulu's unique market dynamics, limited inventory, and high home values make seller leads expensive to acquire. Agents here should prioritize referral and organic strategies alongside paid campaigns to manage overall acquisition costs.
Google Seller Lead Costs in Bridgeport-Stamford, CT (Q4 2025)
Bridgeport-Stamford-Norwalk posted $24.85 CPL, up 134% year over year. Fairfield County's proximity to New York City and strong luxury market activity are driving increased competition for seller leads. Despite the high cost, the average sale price in this market means the economics can still work for well-positioned agents.
Google Seller Lead Costs in Albuquerque, NM (Q4 2025)
Albuquerque came in at $19.92 CPL, up 119% year over year. New Mexico's largest market has seen significant growth in advertiser activity, pushing seller lead costs sharply higher. Agents should evaluate whether their current conversion rates justify the new cost structure.
Google Seller Lead Costs in Sarasota-North Port, FL (Q4 2025)
North Port-Sarasota-Bradenton posted $21.00 CPL, down 8% year over year. A modest improvement in one of Southwest Florida's most active retirement and relocation markets. Seller leads here are still premium-priced but slightly more accessible than a year ago.
Markets Ranked 76-100
Chattanooga, TN saw the largest seller CPL decrease in this group at -39%. Colorado Springs, CO also fell 22%. Charleston, SC posted the highest CPL at $32.84.
|
Rank |
Market |
CPL |
YoY Change |
|
76 |
Stockton-Lodi, CA |
N/A |
N/A |
|
77 |
Akron, OH |
$8.63 |
+14% |
|
78 |
Charleston-North Charleston, SC |
$32.84 |
+41% |
|
79 |
Colorado Springs, CO |
$10.99 |
-22% |
|
80 |
Syracuse, NY |
N/A |
N/A |
|
81 |
Winston-Salem, NC |
$8.66 |
+32% |
|
82 |
Cape Coral-Fort Myers, FL |
$16.66 |
+28% |
|
83 |
Boise City, ID |
N/A |
N/A |
|
84 |
Wichita, KS |
N/A |
N/A |
|
85 |
Springfield, MA |
N/A |
N/A |
|
86 |
Madison, WI |
N/A |
N/A |
|
87 |
Lakeland-Winter Haven, FL |
$9.87 |
+1% |
|
88 |
Ogden-Clearfield, UT |
N/A |
N/A |
|
89 |
Toledo, OH |
N/A |
N/A |
|
90 |
Deltona-Daytona Beach-Ormond Beach, FL |
$15.53 |
+22% |
|
91 |
Des Moines-West Des Moines, IA |
N/A |
N/A |
|
92 |
Jackson, MS |
N/A |
N/A |
|
93 |
Augusta-Richmond County, GA-SC |
$14.61 |
+66% |
|
94 |
Scranton-Wilkes-Barre-Hazleton, PA |
N/A |
N/A |
|
95 |
Youngstown-Warren-Boardman, OH-PA |
N/A |
N/A |
|
96 |
Harrisburg-Carlisle, PA |
N/A |
N/A |
|
97 |
Provo-Orem, UT |
N/A |
N/A |
|
98 |
Palm Bay-Melbourne-Titusville, FL |
N/A |
N/A |
|
99 |
Chattanooga, TN-GA |
$13.33 |
-39% |
|
100 |
Spokane-Spokane Valley, WA |
N/A |
N/A |
Google Seller Lead Costs in Charleston, SC (Q4 2025)
Charleston-North Charleston posted $32.84 CPL, the highest of any market in the 76-100 group, up 41% year over year. Charleston's strong demand from out-of-state buyers and retirees has made it one of the most competitive seller lead environments in the Southeast. Agents here should weigh paid lead generation against referral-based strategies to maintain a healthy cost per acquisition.
Google Seller Lead Costs in Colorado Springs, CO (Q4 2025)
Colorado Springs came in at $10.99 CPL, down 22% year over year, making it one of the most improved seller lead markets in the full top 100. For agents operating in this market, the combination of lower acquisition cost and active military relocation demand creates a favorable environment for seller campaigns heading into 2026.
Google Seller Lead Costs in Chattanooga, TN (Q4 2025)
Chattanooga-Hamilton County posted $13.33 CPL, down 39% year over year, the largest decrease of any market in the 76-100 group. Chattanooga's improving cost profile makes it one to watch for agents looking to expand into Tennessee markets beyond Nashville.
Google Seller Lead Costs in Akron, OH (Q4 2025)
Akron posted $8.63 CPL, up just 14% year over year, and ranks fifth overall for the lowest seller CPL of any market tracked. For agents in the Akron area, seller leads on Google remain among the most cost-efficient in the country.
Google Seller Lead Costs in Cape Coral-Fort Myers, FL (Q4 2025)
Cape Coral-Fort Myers came in at $16.66 CPL, up 28% year over year. Southwest Florida's ongoing appeal as a retirement and second-home destination continues to drive seller activity, though costs have risen notably from prior-year levels.
What to Expect for Google Seller Lead Costs in Q1 2026
Q4 is historically the most expensive quarter for both buyer and seller leads. As we move into Q1, costs typically ease as holiday ad competition fades. For seller campaigns specifically, Q1 aligns well with homeowner behavior: many sellers begin thinking seriously about listing in late winter ahead of the spring market, making early Q1 a valuable window for capturing intent.
Agents who activate or scale their Google Seller campaigns in January and February tend to see their best cost-per-lead figures of the year. Getting in front of potential sellers before spring inventory season heats up is one of the highest-leverage moves an agent can make with their ad budget.
CINC is the leader in online real estate lead generation with more than 50,000 clients. This behind-the-scenes lead cost data is what we were seeing for our portfolio of real estate team and agent clients during Q4 2025. The CINC client marketing team manages almost $30 million in search and social advertising spend annually for real estate teams and agents across the United States and Canada. If you want to see how CINC can help you find more higher quality hyperlocal real estate leads on Google, request a demo here.
Additional Google Real Estate Lead Gen Resources from CINC:
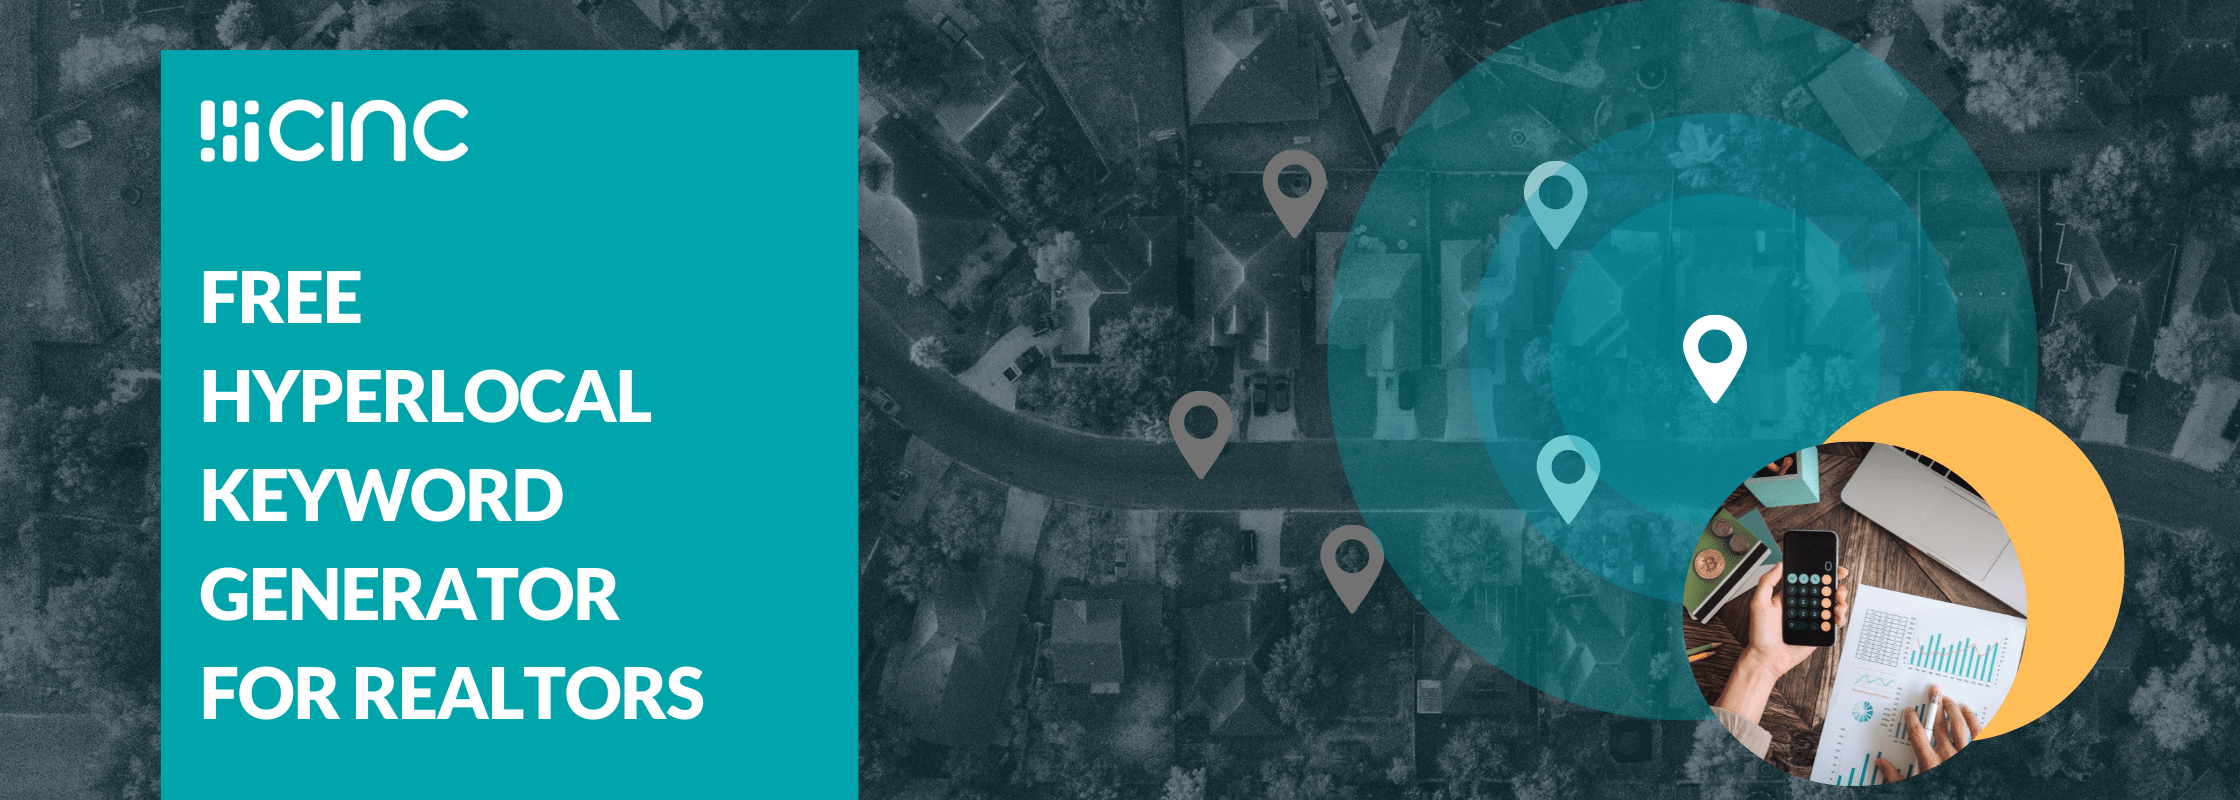
In a shifting real estate market, it is more important than ever to be more efficient paying for leads on Google. Try our free local Google real estate targeting tool here to find hidden pockets of more cost effective hyper-local leads near you.
.png?width=2240&height=800&name=Secret%20Submarket%20Finder%20Tool%20(1).png)
Watch our recent on-demand real estate lead gen webinar here where we discuss new trends for real estate teams and agents on Google Ads, including a deep dive on Google Local Service Ads (LSA's) for realtors.
Here are links to past historic Real Estate Seller Cost Per Lead Reports for Q3 2025, Q2 2025, Q1 2025, Q4 2024, Q3 2024, Q2 2024, Q1 2024, Q4 2023, Q3 2023, Q2 2023, Q1 2023, Q4 2022, Q3 2022, Q2 2022, Q1 2022, Q4 2021, Q3 2021, Q2 2021, Q1 2021.