

.svg)

.png)

Q1 2026 was a strong quarter for both buyer and seller lead costs, and that is exactly what the seasonal pattern predicted.
CPL across CINC's Google Buyer portfolio decreased in Q1 2026 compared to Q4 2025, driven by a seasonal decline in cost per click. Seller lead costs followed the same direction, though the improvement was more modest. This is the most consistent pattern in the report: Q4 is the most expensive quarter for both lead types, and Q1 is typically the most affordable window to invest. For agents who held back on ad spend toward the end of last year, Q1 was the window to reinvest on both sides of the transaction.
For buyer leads, Bangor, ME held the top spot for the lowest overall CPL for the second consecutive quarter, and St. Louis repeated as the most affordable big market. For seller leads, Florence-Muscle Shoals, AL posted the lowest CPL of any market tracked, and Detroit held its position as the most affordable big market for seller lead generation.
Budget Takeaway: Q1 is historically the strongest quarter for Google lead cost efficiency. As we move into Q2 and Q3, CPL tends to moderate upward before peaking again in Q4. If you did not scale your ad spend in Q1, the next best time to act is now, before costs climb through spring and summer.
.png?width=1200&height=675&name=2026%20Blog%20Featured%20Images%20(30).png)
Top 10 Lowest CPL Buyer Markets (All Markets, Q1 2026)
The most affordable Google Buyer lead markets in the country this quarter. Bangor, ME claimed the top spot for the second quarter in a row. The full top 10 is dominated by smaller markets in the South and Northeast, where lower advertiser competition keeps acquisition costs well below the national average.
|
Rank |
Market |
CPL |
|
1 |
Bangor, ME |
$1.64 |
|
2 |
The Villages, FL |
$2.25 |
|
3 |
Murray, KY |
$2.51 |
|
4 |
Corsicana, TX |
$2.66 |
|
5 |
Pittsfield, MA |
$3.09 |
|
6 |
Crossville, TN |
$3.13 |
|
7 |
Andrews, TX |
$3.17 |
|
8 |
Hot Springs, AR |
$3.28 |
|
9 |
Longview, TX |
$3.29 |
|
10 |
Claremont-Lebanon, NH-VT |
$3.54 |
Note: These markets are primarily smaller population centers where limited advertiser competition keeps CPL low. For agents willing to work a regional footprint, they can represent exceptional lead volume per dollar.
Top 10 Lowest CPL Buyer Markets: Big Markets (Q1 2026)
The most affordable Google Buyer lead markets among the 100 largest U.S. metro areas. St. Louis held the number one spot among big markets for the third consecutive quarter. Philadelphia and Chicago round out the top three, both posting CPLs under $7.
|
Rank |
Market |
CPL |
|
1 |
St. Louis, MO-IL |
$6.22 |
|
2 |
Philadelphia-Camden-Wilmington, PA-NJ-DE-MD |
$6.27 |
|
3 |
Chicago-Naperville-Elgin, IL-IN-WI |
$6.73 |
|
4 |
Tampa-St. Petersburg-Clearwater, FL |
$7.04 |
|
5 |
Detroit-Warren-Dearborn, MI |
$7.09 |
|
6 |
Dallas-Fort Worth-Arlington, TX |
$7.19 |
|
7 |
Houston-The Woodlands-Sugar Land, TX |
$7.33 |
|
8 |
Atlanta-Sandy Springs-Roswell, GA |
$7.58 |
|
9 |
Baltimore-Columbia-Towson, MD |
$7.77 |
|
10 |
Miami-Fort Lauderdale-West Palm Beach, FL |
$8.01 |
Top 10 Lowest CPL Seller Markets (All Markets, Q1 2026)
The most affordable Google Seller lead markets in the country this quarter. Florence-Muscle Shoals, AL claimed the top spot with a $6.21 CPL. Louisville and Bangor both appear in the top three across buyer and seller categories, reinforcing their status as consistently efficient markets for lead generation investment.
|
Rank |
Market |
CPL |
|
1 |
Florence-Muscle Shoals, AL |
$6.21 |
|
2 |
Louisville/Jefferson County, KY-IN |
$7.11 |
|
3 |
Bangor, ME |
$7.12 |
|
4 |
Detroit-Warren-Dearborn, MI |
$7.86 |
|
5 |
Akron, OH |
$7.88 |
|
6 |
Ocala, FL |
$8.11 |
|
7 |
Modesto, CA |
$9.17 |
|
8 |
Corsicana, TX |
$9.32 |
|
9 |
Augusta-Richmond County, GA-SC |
$9.85 |
|
10 |
Winston-Salem, NC |
$10.12 |
Top 10 Lowest CPL Seller Markets: Big Markets (Q1 2026)
The most affordable seller lead markets among the 100 largest U.S. metro areas. Detroit held the number one big market spot for seller leads at $7.86, the lowest of any large metro in the country. The gap between Detroit and the next closest market is notable: Dallas came in at $11.81, nearly $4 higher. The rest of the top 10 clusters between $12 and $15.
|
Rank |
Market |
CPL |
|
1 |
Detroit-Warren-Dearborn, MI |
$7.86 |
|
2 |
Dallas-Fort Worth-Arlington, TX |
$11.81 |
|
3 |
Philadelphia-Camden-Wilmington, PA-NJ-DE-MD |
$12.10 |
|
4 |
Minneapolis-St. Paul-Bloomington, MN-WI |
$13.34 |
|
5 |
Atlanta-Sandy Springs-Roswell, GA |
$14.24 |
|
6 |
New York-Newark-Jersey City, NY-NJ-PA |
$14.56 |
|
7 |
San Diego-Carlsbad, CA |
$14.75 |
|
8 |
San Francisco-Oakland-Hayward, CA |
$14.84 |
|
9 |
Baltimore-Columbia-Towson, MD |
$15.19 |
|
10 |
Chicago-Naperville-Elgin, IL-IN-WI |
$15.24 |
Note: A full seller CPL breakdown by market is not included in this combined report. To find out what seller leads cost in your specific market or submarket, request more info at cincpro.com.
Full Buyer Top 100: Q1 2026 CPL and Quarter-Over-Quarter Change
Find your market. See what changed. The change column reflects the shift from Q4 2025 to Q1 2026. A few things worth flagging before you scan:
- El Paso, TX saw the largest CPL decrease of any market in the top 100, falling 32%.
- New Haven, CT dropped 20% and Akron, OH fell 14%, two other notable improvements.
- Spokane, WA saw the largest increase at +63%, continuing the upward trend seen in Q4.
- Nashville (+30%), Hartford (+39%), and Virginia Beach (+28%) also saw meaningful increases despite the otherwise favorable Q1 seasonal environment.
Markets Ranked 1-25
Tampa (-2%) and Miami (+2%) were the most stable major markets in this group. Denver (+16%), San Antonio (+23%), and San Francisco (+23%) saw the sharpest increases.
|
Rank |
Market |
CPL |
QoQ Change |
|
1 |
New York-Newark-Jersey City, NY-NJ-PA |
$8.73 |
+15% |
|
2 |
Los Angeles-Long Beach-Anaheim, CA |
$11.58 |
+2% |
|
3 |
Chicago-Naperville-Elgin, IL-IN-WI |
$6.73 |
+16% |
|
4 |
Dallas-Fort Worth-Arlington, TX |
$7.19 |
+5% |
|
5 |
Houston-The Woodlands-Sugar Land, TX |
$7.33 |
+16% |
|
6 |
Philadelphia-Camden-Wilmington, PA-NJ-DE-MD |
$6.27 |
+4% |
|
7 |
Washington-Arlington-Alexandria, DC-VA-MD-WV |
$9.69 |
+15% |
|
8 |
Miami-Fort Lauderdale-West Palm Beach, FL |
$8.01 |
+2% |
|
9 |
Atlanta-Sandy Springs-Roswell, GA |
$7.58 |
+17% |
|
10 |
Boston-Cambridge-Newton, MA-NH |
$9.25 |
+17% |
|
11 |
San Francisco-Oakland-Hayward, CA |
$11.44 |
+23% |
|
12 |
Riverside-San Bernardino-Ontario, CA |
$9.02 |
+4% |
|
13 |
Phoenix-Mesa-Scottsdale, AZ |
$9.13 |
+6% |
|
14 |
Detroit-Warren-Dearborn, MI |
$7.09 |
+11% |
|
15 |
Seattle-Tacoma-Bellevue, WA |
$10.93 |
+14% |
|
16 |
Minneapolis-St. Paul-Bloomington, MN-WI |
$8.82 |
+9% |
|
17 |
San Diego-Carlsbad, CA |
$10.88 |
+2% |
|
18 |
Tampa-St. Petersburg-Clearwater, FL |
$7.04 |
-2% |
|
19 |
St. Louis, MO-IL |
$6.22 |
+15% |
|
20 |
Baltimore-Columbia-Towson, MD |
$7.77 |
+5% |
|
21 |
Denver-Aurora-Lakewood, CO |
$12.16 |
+16% |
|
22 |
Pittsburgh, PA |
$6.30 |
+19% |
|
23 |
Charlotte-Concord-Gastonia, NC-SC |
$7.22 |
+8% |
|
24 |
Portland-Vancouver-Hillsboro, OR-WA |
$9.98 |
+16% |
|
25 |
San Antonio-New Braunfels, TX |
$8.36 |
+23% |
Google Buyer Lead Costs in New York, NY (Q1 2026)
New York-Newark-Jersey City came in at $8.73 CPL, up 15% from Q4 2025. Despite the quarter-over-quarter increase, New York's Q1 CPL is consistent with seasonal norms. The market's high transaction values continue to make Google Buyer campaigns a strong investment for agents operating here.
Google Buyer Lead Costs in Los Angeles, CA (Q1 2026)
Los Angeles-Long Beach-Anaheim posted $11.58 CPL, up just 2% from Q4. One of the most stable large markets in the report this quarter, LA's modest increase is notable given the sharp rise seen in several other coastal markets.
Google Buyer Lead Costs in Chicago, IL (Q1 2026)
Chicago-Naperville-Elgin came in at $6.73 CPL, up 16% from Q4, and ranks third among big markets for buyer lead affordability. Chicago remains a cost-efficient market for Google Buyer investment relative to its size.
Google Buyer Lead Costs in Dallas-Fort Worth, TX (Q1 2026)
Dallas-Fort Worth-Arlington posted $7.19 CPL, up just 5% from Q4. DFW continues to be one of the most efficient big markets in the country for Google Buyer ad spend, combining low CPL with high transaction volume.
Google Buyer Lead Costs in Houston, TX (Q1 2026)
Houston-The Woodlands-Sugar Land came in at $7.33 CPL, up 16% from Q4. Houston remains in the top 10 big markets for buyer lead affordability and is one of the steadier performers in the CINC portfolio quarter over quarter.
Google Buyer Lead Costs in Philadelphia, PA (Q1 2026)
Philadelphia-Camden-Wilmington posted $6.27 CPL, up just 4% from Q4, and holds the second spot among big markets. Philadelphia continues to deliver among the lowest buyer lead costs of any large Northeastern market.
Google Buyer Lead Costs in Washington, DC (Q1 2026)
Washington-Arlington-Alexandria came in at $9.69 CPL, up 15% from Q4. The DC metro's cost increase tracks with the broader seasonal pattern, and the market's high median home values continue to support strong ROI on buyer lead spend.
Google Buyer Lead Costs in Miami, FL (Q1 2026)
Miami-Fort Lauderdale-West Palm Beach posted $8.01 CPL, up just 2% from Q4, making it one of the most stable large Florida markets in Q1. Miami also ranks tenth among big markets for overall buyer lead affordability this quarter.
Google Buyer Lead Costs in Atlanta, GA (Q1 2026)
Atlanta-Sandy Springs-Roswell came in at $7.58 CPL, up 17% from Q4, and ranks eighth among big markets. Atlanta's continued population growth keeps buyer demand healthy, though the cost increase warrants attention for teams managing tight ad budgets.
Google Buyer Lead Costs in Boston, MA (Q1 2026)
Boston-Cambridge-Newton posted $9.25 CPL, up 17% from Q4. Despite the increase, Boston's strong median home prices keep the return on buyer lead investment well above the national average.
Google Buyer Lead Costs in San Francisco, CA (Q1 2026)
San Francisco-Oakland-Hayward came in at $11.44 CPL, up 23% from Q4. Despite the increase, San Francisco's extraordinary home values mean the math on Google Buyer campaigns still works strongly for teams with solid conversion systems.
Google Buyer Lead Costs in Seattle, WA (Q1 2026)
Seattle-Tacoma-Bellevue posted $10.93 CPL, up 14% from Q4. Seattle's strong home values and active buyer pool continue to make it a productive market for Google Buyer investment, even as CPL climbs.
Google Buyer Lead Costs in Tampa, FL (Q1 2026)
Tampa-St. Petersburg-Clearwater posted $7.04 CPL, down 2% from Q4, making it the only top-25 market to see a CPL decrease. Tampa also ranks fourth among big markets for buyer lead affordability, making it one of the stronger value propositions in Florida.
Google Buyer Lead Costs in St. Louis, MO (Q1 2026)
St. Louis-MO-IL posted $6.22 CPL, up 15% from Q4, and holds the top spot among big markets for buyer lead affordability for the third consecutive quarter. For agents and teams looking for high lead volume at a manageable cost, St. Louis remains the benchmark market in the CINC portfolio.
Google Buyer Lead Costs in Denver, CO (Q1 2026)
Denver-Aurora-Lakewood came in at $12.16 CPL, up 16% from Q4, the highest CPL of any market ranked in the top 25 by population. Denver's strong home values and active buyer market continue to drive advertiser competition, keeping costs elevated relative to other Mountain West markets.
Google Buyer Lead Costs in Charlotte, NC (Q1 2026)
Charlotte-Concord-Gastonia posted $7.22 CPL, up 8% from Q4. Charlotte remains one of the more affordable mid-size markets for Google Buyer lead investment in the Southeast, with a low CPL and a healthy buyer pool driven by continued in-migration.
Markets Ranked 26-50
Orlando (-3%), Cincinnati (-6%), and Austin (-4%) all posted CPL decreases in Q1, the standout improvements in this group. Hartford (+39%) and Nashville (+30%) saw the sharpest increases.
|
Rank |
Market |
CPL |
QoQ Change |
|
26 |
Orlando-Kissimmee-Sanford, FL |
$6.46 |
-3% |
|
27 |
Sacramento-Roseville-Arden-Arcade, CA |
$9.97 |
+12% |
|
28 |
Cincinnati, OH-KY-IN |
$5.20 |
-6% |
|
29 |
Cleveland-Elyria, OH |
$6.62 |
+15% |
|
30 |
Kansas City, MO-KS |
$6.70 |
+12% |
|
31 |
Las Vegas-Henderson-Paradise, NV |
$11.39 |
+9% |
|
32 |
Columbus, OH |
$8.08 |
+9% |
|
33 |
Indianapolis-Carmel-Anderson, IN |
$7.27 |
+17% |
|
34 |
San Jose-Sunnyvale-Santa Clara, CA |
$17.47 |
+13% |
|
35 |
Austin-Round Rock, TX |
$8.87 |
-4% |
|
36 |
Nashville-Davidson-Murfreesboro-Franklin, TN |
$9.48 |
+30% |
|
37 |
Virginia Beach-Norfolk-Newport News, VA-NC |
$10.78 |
+28% |
|
38 |
Providence-Warwick, RI-MA |
$6.46 |
+5% |
|
39 |
Milwaukee-Waukesha-West Allis, WI |
$7.14 |
+20% |
|
40 |
Jacksonville, FL |
$7.01 |
+15% |
|
41 |
Memphis, TN-MS-AR |
$5.06 |
+17% |
|
42 |
Oklahoma City, OK |
$8.14 |
+22% |
|
43 |
Louisville/Jefferson County, KY-IN |
$5.38 |
+20% |
|
44 |
Richmond, VA |
$8.10 |
+8% |
|
45 |
New Orleans-Metairie, LA |
$4.18 |
+12% |
|
46 |
Hartford-West Hartford-East Hartford, CT |
$7.15 |
+39% |
|
47 |
Raleigh, NC |
$8.36 |
-5% |
|
48 |
Birmingham-Hoover, AL |
$5.49 |
+19% |
|
49 |
Buffalo-Cheektowaga-Niagara Falls, NY |
$5.12 |
+27% |
|
50 |
Salt Lake City, UT |
$11.09 |
+12% |
Google Buyer Lead Costs in Orlando, FL (Q1 2026)
Orlando-Kissimmee-Sanford posted $6.46 CPL, down 3% from Q4. Orlando is one of the few markets where buyer lead costs actually improved quarter over quarter, making it a favorable market for scaling Google Buyer campaigns heading into spring.
Google Buyer Lead Costs in Las Vegas, NV (Q1 2026)
Las Vegas-Henderson-Paradise came in at $11.39 CPL, up 9% from Q4. Las Vegas remains one of the pricier buyer lead markets in the West, though the quarter-over-quarter increase was more modest than in several comparable markets.
Google Buyer Lead Costs in Austin, TX (Q1 2026)
Austin-Round Rock posted $8.87 CPL, down 4% from Q4. Austin's slight improvement is a welcome shift after several quarters of significant cost increases, and it positions the market more favorably heading into the spring buying season.
Google Buyer Lead Costs in Nashville, TN (Q1 2026)
Nashville-Davidson-Murfreesboro-Franklin came in at $9.48 CPL, up 30% from Q4, the largest increase of any market in the 26-50 group. Nashville's continued status as a top relocation destination is driving sustained advertiser competition. Teams running Google Buyer campaigns here should review their budget assumptions for Q2.
Google Buyer Lead Costs in Virginia Beach, VA (Q1 2026)
Virginia Beach-Norfolk-Newport News posted $10.78 CPL, up 28% from Q4. The Hampton Roads market has seen CPL climb sharply over the past two quarters. Agents here should monitor cost trends closely and evaluate whether current campaign structures are still delivering acceptable ROI.
Google Buyer Lead Costs in Raleigh, NC (Q1 2026)
Raleigh posted $8.36 CPL, down 5% from Q4. Like Austin, Raleigh's modest improvement is a positive sign after a period of upward pressure. The Research Triangle's continued growth as a tech and university hub keeps the buyer pool deep and active.
Google Buyer Lead Costs in Salt Lake City, UT (Q1 2026)
Salt Lake City came in at $11.09 CPL, up 12% from Q4. Utah's continued population growth and strong job market keep buyer demand elevated. Salt Lake City remains one of the more expensive markets in the Mountain West for Google Buyer lead acquisition.
Markets Ranked 51-75
El Paso (-32%), Oxnard-Ventura (-17%), New Haven (-20%), and North Port-Sarasota (-8%) all saw meaningful CPL decreases. Urban Honolulu (+45%) and Tulsa (+33%) posted the sharpest increases in this group.
|
Rank |
Market |
CPL |
QoQ Change |
|
51 |
Rochester, NY |
$4.67 |
+26% |
|
52 |
Grand Rapids-Wyoming, MI |
$8.77 |
+8% |
|
53 |
Tucson, AZ |
$8.79 |
+16% |
|
54 |
Urban Honolulu, HI |
$7.35 |
+45% |
|
55 |
Tulsa, OK |
$6.50 |
+33% |
|
56 |
Fresno, CA |
$5.96 |
-1% |
|
57 |
Bridgeport-Stamford-Norwalk, CT |
$7.61 |
+16% |
|
58 |
Worcester, MA-CT |
$6.83 |
+18% |
|
59 |
Albuquerque, NM |
$9.08 |
+17% |
|
60 |
Omaha-Council Bluffs, NE-IA |
$5.48 |
-2% |
|
61 |
Albany-Schenectady-Troy, NY |
$5.08 |
+23% |
|
62 |
New Haven-Milford, CT |
$7.06 |
-20% |
|
63 |
Bakersfield, CA |
$9.51 |
+16% |
|
64 |
Knoxville, TN |
$7.26 |
+4% |
|
65 |
Greenville-Anderson-Mauldin, SC |
$6.50 |
+6% |
|
66 |
Oxnard-Thousand Oaks-Ventura, CA |
$5.12 |
-17% |
|
67 |
El Paso, TX |
$4.10 |
-32% |
|
68 |
Allentown-Bethlehem-Easton, PA-NJ |
$6.23 |
+12% |
|
69 |
Baton Rouge, LA |
$4.81 |
N/A |
|
70 |
McAllen-Edinburg-Mission, TX |
$4.78 |
N/A |
|
71 |
Dayton, OH |
$7.26 |
+24% |
|
72 |
Columbia, SC |
$6.50 |
+37% |
|
73 |
Greensboro-High Point, NC |
$6.47 |
+29% |
|
74 |
North Port-Sarasota-Bradenton, FL |
$8.10 |
-8% |
|
75 |
Little Rock-North Little Rock-Conway, AR |
$4.98 |
+37% |
Google Buyer Lead Costs in El Paso, TX (Q1 2026)
El Paso posted $4.10 CPL, down 32% from Q4, the largest decrease of any market in the entire top 100. For agents active in El Paso, Q1 2026 offered exceptional cost efficiency. At this price point, agents can generate substantial lead volume with a modest monthly ad budget.
Google Buyer Lead Costs in Honolulu, HI (Q1 2026)
Urban Honolulu came in at $7.35 CPL, up 45% from Q4, the largest increase in this group. Despite the sharp rise, Honolulu's CPL is still relatively moderate given its high median home values, which means the ROI math can still hold for agents with strong conversion systems.
Google Buyer Lead Costs in New Haven, CT (Q1 2026)
New Haven-Milford posted $7.06 CPL, down 20% from Q4, one of the larger improvements in the 51-75 group. New Haven continues to benefit from its proximity to the New York metro while maintaining significantly lower lead costs than comparable Connecticut markets like Bridgeport-Stamford.
Google Buyer Lead Costs in Oxnard-Ventura, CA (Q1 2026)
Oxnard-Thousand Oaks-Ventura came in at $5.12 CPL, down 17% from Q4. Despite posting one of the highest Lead Value Index scores in the country last quarter due to strong home values, Ventura County's buyer lead costs remain among the most manageable in California.
Google Buyer Lead Costs in Knoxville, TN (Q1 2026)
Knoxville posted $7.26 CPL, up just 4% from Q4, one of the more stable performers in this group. Knoxville continues to attract buyers from higher-cost metros in the Southeast and Northeast, making it a solid market for agents who work relocation buyers effectively.
Markets Ranked 76-100
Harrisburg (-14%), Boise (-14%), Cape Coral-Fort Myers (-12%), and Colorado Springs (-6%) all saw CPL decrease from Q4. Spokane (+63%), Madison (+48%), and Des Moines (+42%) had the largest increases in this group.
|
Rank |
Market |
CPL |
QoQ Change |
|
76 |
Stockton-Lodi, CA |
N/A |
N/A |
|
77 |
Akron, OH |
$5.72 |
-14% |
|
78 |
Charleston-North Charleston, SC |
$10.74 |
+11% |
|
79 |
Colorado Springs, CO |
$9.12 |
-6% |
|
80 |
Syracuse, NY |
$4.59 |
+28% |
|
81 |
Winston-Salem, NC |
$6.36 |
+35% |
|
82 |
Cape Coral-Fort Myers, FL |
$6.39 |
-12% |
|
83 |
Boise City, ID |
$9.28 |
-14% |
|
84 |
Wichita, KS |
N/A |
N/A |
|
85 |
Springfield, MA |
$8.12 |
-9% |
|
86 |
Madison, WI |
$9.26 |
+48% |
|
87 |
Lakeland-Winter Haven, FL |
$5.93 |
+13% |
|
88 |
Ogden-Clearfield, UT |
$10.23 |
+8% |
|
89 |
Toledo, OH |
$5.28 |
-2% |
|
90 |
Deltona-Daytona Beach-Ormond Beach, FL |
$6.53 |
-2% |
|
91 |
Des Moines-West Des Moines, IA |
$6.58 |
+42% |
|
92 |
Jackson, MS |
$6.01 |
+61% |
|
93 |
Augusta-Richmond County, GA-SC |
$4.39 |
+39% |
|
94 |
Scranton-Wilkes-Barre-Hazleton, PA |
N/A |
N/A |
|
95 |
Youngstown-Warren-Boardman, OH-PA |
N/A |
N/A |
|
96 |
Harrisburg-Carlisle, PA |
$7.60 |
-14% |
|
97 |
Provo-Orem, UT |
$10.26 |
+2% |
|
98 |
Palm Bay-Melbourne-Titusville, FL |
$6.57 |
-3% |
|
99 |
Chattanooga, TN-GA |
$6.53 |
+31% |
|
100 |
Spokane-Spokane Valley, WA |
$14.27 |
+63% |
Google Buyer Lead Costs in Cape Coral-Fort Myers, FL (Q1 2026)
Cape Coral-Fort Myers posted $6.39 CPL, down 12% from Q4. Southwest Florida's market normalization continues to work in favor of agents here, with buyer lead costs falling for the second consecutive quarter. This is one of the more improved markets in the full top 100 on a recent trend basis.
Google Buyer Lead Costs in Boise, ID (Q1 2026)
Boise City came in at $9.28 CPL, down 14% from Q4. After several quarters of elevated costs driven by pandemic-era in-migration, Boise's buyer lead costs are beginning to moderate. This is a positive signal for agents who may have pulled back on Google Buyer spend in prior quarters.
Google Buyer Lead Costs in Colorado Springs, CO (Q1 2026)
Colorado Springs posted $9.12 CPL, down 6% from Q4. Colorado Springs continues to show steady improvement on the buyer side, and when combined with the seller CPL decrease reported last quarter, it is one of the more broadly improving markets in the Mountain West.
Google Buyer Lead Costs in Spokane, WA (Q1 2026)
Spokane-Spokane Valley came in at $14.27 CPL, up 63% from Q4, the largest increase of any market in the full top 100. Spokane's cost profile has risen sharply over the past two quarters. Agents running Google Buyer campaigns here should closely evaluate whether current conversion rates justify the significantly higher acquisition cost.
Google Buyer Lead Costs in Charleston, SC (Q1 2026)
Charleston-North Charleston posted $10.74 CPL, up 11% from Q4. Charleston remains one of the pricier buyer lead markets in the Southeast, reflecting the continued demand from retirees and out-of-state buyers. The modest increase suggests costs may be stabilizing after sharper moves in prior quarters.
What to Expect from Q2 2026
Q1 delivered on its seasonal promise: lower CPL, better efficiency, and a stronger window for ad spend investment. As we move into Q2, expect costs to begin rising moderately in most markets as spring buying season picks up and more advertisers compete for visibility.
The markets that saw CPL decreases in Q1 represent particularly strong opportunities heading into Q2, where lower baseline costs can absorb the expected seasonal increase while still delivering solid ROI.
For seller leads specifically, Q2 and Q3 tend to be productive seasons as sellers who were evaluating their options over the winter begin to list. The seasonal cost increase for sellers is typically less dramatic than for buyers, meaning the window for efficient seller campaigns extends a bit further into the year.
CINC is the leader in online real estate lead generation with more than 50,000 clients. This behind-the-scenes lead cost data is what we were seeing for our portfolio of real estate team and agent clients during Q4 2025. The CINC client marketing team manages almost $30 million in search and social advertising spend annually for real estate teams and agents across the United States and Canada. If you want to see how CINC can help you find more higher quality hyperlocal real estate leads on Google, request a demo here.
Additional Google Real Estate Lead Gen Resources from CINC:
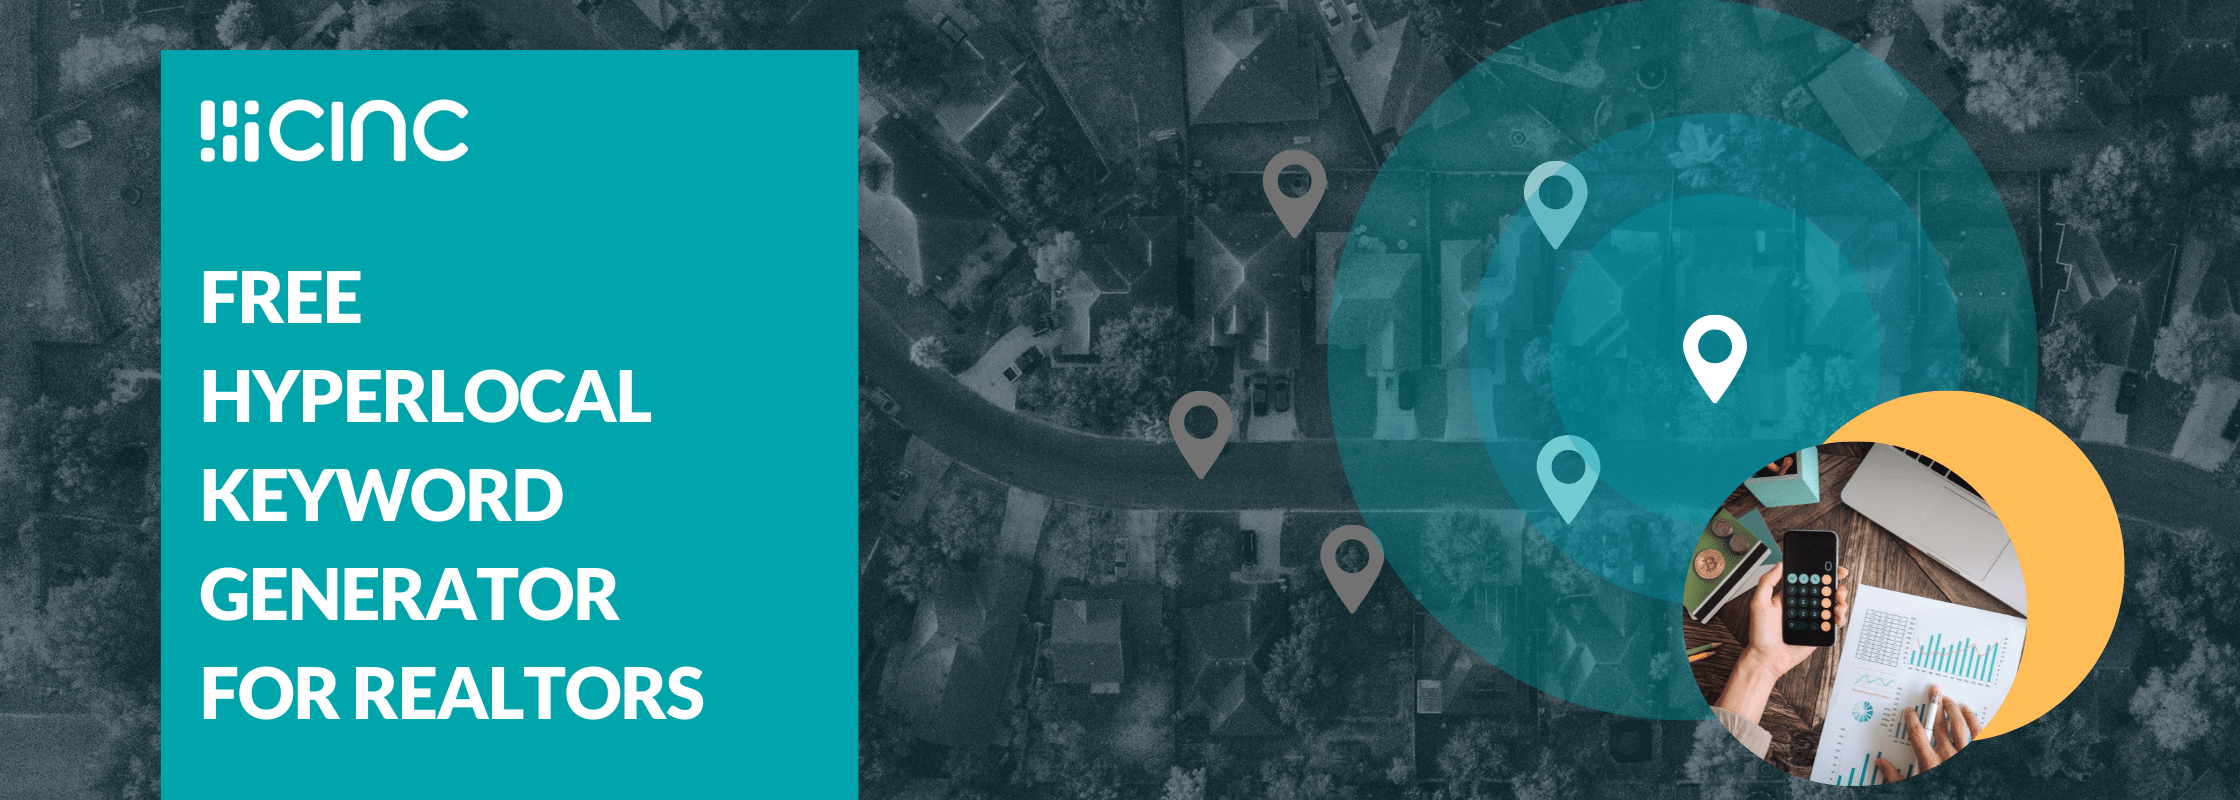
With buyer cost per lead up recently, it is more important than ever to be more efficient paying for leads on Google. Try our free local Google real estate targeting tool here to find hidden pockets of more cost effective hyper-local leads near you.
.png?width=2240&height=800&name=Secret%20Submarket%20Finder%20Tool%20(1).png)
Here are links to past historic Buyer Cost Per Lead Reports for Q4 2025, Q3 2025, Q2 2025, Q1 2025, Q4 2024,Q3 2024, Q2 2024, Q1 2024, Q4 2023, Q3 2023, Q2 2023, Q1 2023, Q4 2022, Q3 2022, Q2 2022, Q1 2022, Q4 2021, Q3 2021, Q2 2021, Q1 2021, Q4 2020, Q3 2020, Q2 2020, Q1 2020.