

.svg)

.png)


.png?width=770&height=434&name=Real%20Estate%20Lead%20Cost%20Report%20for%20Buyers%20on%20Google%20Q3%202023%20(1).png)
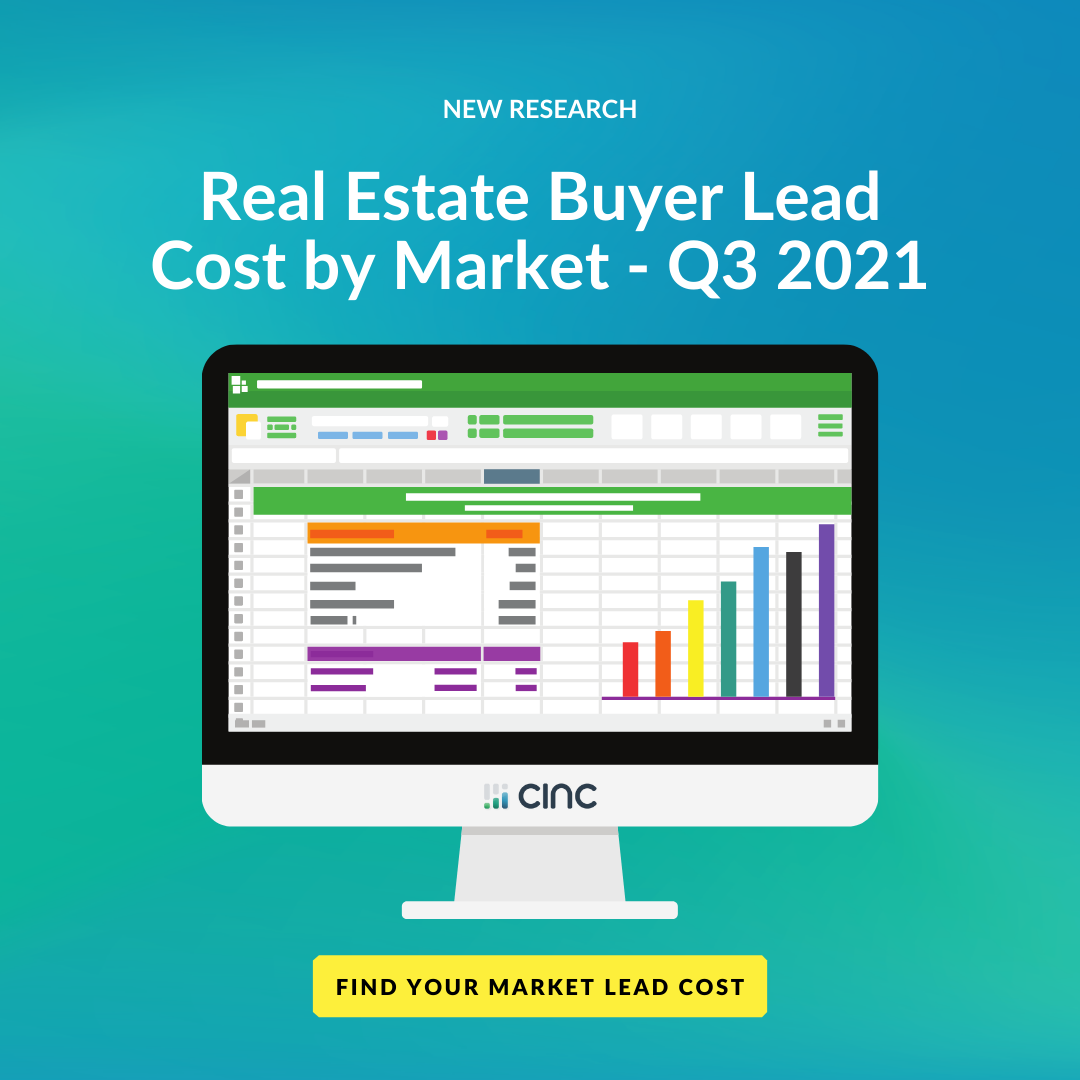
We saw notable price decreases for home buyer leads on Google Ads in CINC's portfolio of ad spend for real estate team and agent clients in Q3 2023.
This presented a unique opportunity for realtors as Q3 CPL's (cost per lead) are historically higher than Q2.
Of the largest markets, we saw the largest decreases in buyer lead costs out West in Portland, San Francisco, and Denver.
Drilling down to cities - the top three large markets for lowest cost buyer leads were St. Louis, Chicago, and Houston. Fans of the market report will notice that this was the fourth consecutive quarter that these three were on top in this order. There was a minor change with the most expensive large markets for buyer leads with Phoenix supplanting Los Angeles in the top 3, joining San Francisco and Seattle.
Unlike the big cities, there was a big shakeup when looking at all markets. The top 4 are now Salina, KS; Bangor, ME; Laconia, NH; and Hot Springs, AR. Each had a cost per lead less than $2.
CINC is the leader in online real estate lead generation with more than 50,000 clients. This behind-the-scenes lead cost data is what we were seeing for our portfolio of real estate team and agent clients during Q3 2023. The CINC client marketing team manages almost $30 million in search and social advertising spend annually for real estate teams and agents across the United States and Canada. If you want to see how CINC can help you find more higher quality hyperlocal real estate leads on Google, request a demo here.
Large Markets with Largest Real Estate Lead Cost Declines for Buyers on Google
Portland (ranked #1), San Francisco (#2), and Denver (#3) saw the 3 largest buyer cost per lead declines of the largest markets.
Northern and West Coast cities were the most well-represented in the Top 10. Sun Belt cities were scarce in the Top 10, only including Dallas (#7) and Atlanta (#9).
| Market Rank | Market | Q3 2023 Cost Per Lead (CPL) | % Change Quarter-Over-Quarter |
| 1 | Portland-Vancouver-Hillsboro, OR-WA | $ 8.39 | -13.1% |
| 2 | San Francisco-Oakland-Hayward, CA | $ 11.83 | -9.8% |
| 3 | Denver-Aurora-Lakewood, CO | $ 9.77 | -9.8% |
| 4 | Pittsburgh, PA | $ 5.20 | -8.9% |
| 5 | Chicago-Naperville-Elgin, IL-IN-WI | $ 5.29 | -7.0% |
| 6 | Detroit-Warren-Dearborn, MI | $ 6.82 | -7.0% |
| 7 | Dallas-Fort Worth-Arlington, TX | $ 6.60 | -6.9% |
| 8 | Minneapolis-St. Paul-Bloomington, MN-WI | $ 8.36 | -6.8% |
| 9 | Atlanta-Sandy Springs-Roswell, GA | $ 5.92 | -6.2% |
| 10 | Seattle-Tacoma-Bellevue, WA | $ 10.87 | -5.4% |
Largest Real Estate Lead Cost Declines for Buyers on Google for Top 100 Markets
Bridgeport, Connecticut (44% lead cost decline) saw the largest overall real estate buyer lead cost decline year-over-year.
5 of the 8 markets that saw the largest year-over-year decreases in lead cost in Q3 2023 were located in Northeastern states of Connecticut, Pennsylvania, and New York.
| Market Rank | Market | Q3 2023 Cost Per Lead (CPL) | % Change Quarter-Over-Quarter |
| 1 | Bridgeport-Stamford-Norwalk, CT | $ 3.95 | -44% |
| 2 | Youngstown-Warren-Boardman, OH-PA | $ 4.30 | -26% |
| 3 | Greenville-Anderson-Mauldin, SC | $ 4.57 | -25% |
| 4 | Allentown-Bethlehem-Easton, PA-NJ | $ 3.73 | -24% |
| 5 | Greensboro-High Point, NC | $ 4.11 | -22% |
| 6 | Stockton-Lodi, CA | $ 9.63 | -20% |
| 7 | Hartford-West Hartford-East Hartford, CT | $ 4.77 | -18% |
| 8 | Syracuse, NY | $ 3.51 | -18% |
| 9 | Baton Rouge, LA | $ 4.73 | -17% |
| 10 | Memphis, TN-MS-AR | $ 4.54 | -16% |
Lowest Real Estate Lead Cost Markets for Buyers on Google
Salina (Kansas), Bangor (Maine) and Laconia (New Hampshire) had the lowest real estate buyer lead costs of any market. Salina had a very low $1.65 cost per lead.

5 of the Top 10 lowest real estate lead cost markets were located in Southern states of North Carolina, Arkansas, and Alabama.
| Market Rank | Market | Q3 2023 Cost Per Lead (CPL) |
| 1 |
Salina, KS |
$ 1.65 |
| 2 |
Bangor, ME |
$ 1.70 |
| 3 |
Laconia, NH |
$ 1.86 |
| 4 |
Hot Springs, AR |
$ 1.95 |
| 5 |
Hickory-Lenoir-Morganton, NC |
$ 2.11 |
| 6 |
Kill Devil Hills, NC |
$ 2.14 |
| 7 |
Pinehurst-Southern Pines, NC |
$ 2.16 |
| 8 |
Pittsfield, MA |
$ 2.32 |
| 9 |
Sioux City, IA-NE-SD |
$ 2.49 |
| 10 |
Mobile, AL |
$ 2.60 |
Real Estate Lead Cost for Buyers on Google for Top 100 Markets
|
Rank |
Market |
Q3 2023 Cost Per Lead (CPL) | % Change Quarter-Over-Quarter |
|
1 |
New York-Newark-Jersey City, NY-NJ-PA |
$7.15 | -5% |
|
2 |
$9.74 | -2% | |
|
3 |
Chicago-Naperville-Elgin, IL-IN-WI |
$5.29 | -7% |
|
4 |
Dallas-Fort Worth-Arlington, TX |
$6.60 | -7% |
|
5 |
Houston-The Woodlands-Sugar Land, TX |
$5.25 | -3% |
|
6 |
Philadelphia-Camden-Wilmington, PA-NJ-DE-MD |
$5.71 | -3% |
|
7 |
Washington-Arlington-Alexandria, DC-VA-MD-WV |
$8.36 | -2% |
|
8 |
$7.51 | 6% | |
|
9 |
Atlanta-Sandy Springs-Roswell, GA |
$5.92 | -6% |
|
10 |
Boston-Cambridge-Newton, MA-NH |
$6.69 | -1% |
|
11 |
$11.83 | -10% | |
|
12 |
$8.82 | 1% | |
|
13 |
Phoenix-Mesa-Scottsdale, AZ |
$10.12 | 5% |
|
14 |
Detroit-Warren-Dearborn, MI |
$6.82 | -7% |
|
15 |
Seattle-Tacoma-Bellevue, WA |
$10.87 | -5% |
|
16 |
Minneapolis-St. Paul-Bloomington, MN-WI |
$8.36 | -7% |
|
17 |
$9.20 | -4% | |
|
18 |
$6.58 | 10% | |
|
19 |
St. Louis, MO-IL |
$4.72 | 4% |
|
20 |
Baltimore-Columbia-Towson, MD |
$6.35 | -2% |
|
21 |
Denver-Aurora-Lakewood, CO |
$9.77 | -10% |
|
22 |
Pittsburgh, PA |
$5.20 | -9% |
|
23 |
Charlotte-Concord-Gastonia, NC-SC |
$5.87 | 3% |
|
24 |
Portland-Vancouver-Hillsboro, OR-WA |
$8.39 | -13% |
|
25 |
San Antonio-New Braunfels, TX |
$5.82 | 12% |
|
26 |
$6.19 | 2% | |
|
27 |
$8.23 | -15% | |
|
28 |
Cincinnati, OH-KY-IN |
$5.10 | -9% |
|
29 |
Cleveland-Elyria, OH |
$6.52 | -6% |
|
30 |
Kansas City, MO-KS |
$6.31 | 7% |
|
31 |
Las Vegas-Henderson-Paradise, NV |
$9.83 | 5% |
|
32 |
Columbus, OH |
$5.35 | -3% |
|
33 |
Indianapolis-Carmel-Anderson, IN |
$4.89 | -4% |
|
34 |
$13.19 | 14% | |
|
35 |
Austin-Round Rock, TX |
$8.23 | -3% |
|
36 |
Nashville-Davidson--Murfreesboro--Franklin, TN |
$7.82 | -4% |
|
37 |
Virginia Beach-Norfolk-Newport News, VA-NC |
$7.00 | 3% |
|
38 |
Providence-Warwick, RI-MA |
$5.03 | -11% |
|
39 |
Milwaukee-Waukesha-West Allis, WI |
$5.28 | -7% |
|
40 |
$6.51 | 2% | |
|
41 |
Memphis, TN-MS-AR |
$4.54 | -16% |
|
42 |
Oklahoma City, OK |
$6.58 | 15% |
|
43 |
Louisville/Jefferson County, KY-IN |
$4.96 | -8% |
|
44 |
Richmond, VA |
$6.34 | -10% |
|
45 |
New Orleans-Metairie, LA |
$3.43 | -4% |
|
46 |
Hartford-West Hartford-East Hartford, CT |
$4.77 | -18% |
|
47 |
Raleigh, NC |
$7.36 | -2% |
|
48 |
Birmingham-Hoover, AL |
$4.90 | -2% |
|
49 |
Buffalo-Cheektowaga-Niagara Falls, NY |
$2.85 | -2% |
|
50 |
Salt Lake City, UT |
$9.38 | -4% |
|
Rank |
Market |
Q3 2023 Cost Per Lead (CPL) | % Change Quarter-Over-Quarter |
|
51 |
Rochester, NY |
$3.13 | -9% |
|
52 |
Grand Rapids-Wyoming, MI |
$6.81 | -7% |
|
53 |
Tucson, AZ |
$10.00 | 3% |
|
54 |
Urban Honolulu, HI |
$6.29 | 8% |
|
55 |
Tulsa, OK |
$4.83 | 0% |
|
56 |
$5.21 | -7% | |
|
57 |
Bridgeport-Stamford-Norwalk, CT |
$3.95 | -44% |
|
58 |
Worcester, MA-CT |
$4.54 | -5% |
|
59 |
Albuquerque, NM |
$7.77 | 1% |
|
60 |
Omaha-Council Bluffs, NE-IA |
$4.43 | -5% |
|
61 |
Albany-Schenectady-Troy, NY |
$4.05 | -9% |
|
62 |
New Haven-Milford, CT |
$5.68 | 5% |
|
63 |
$7.28 | 3% | |
|
64 |
Knoxville, TN |
$5.26 | -11% |
|
65 |
Greenville-Anderson-Mauldin, SC |
$4.57 | -25% |
|
66 |
$7.30 | -7% | |
|
67 |
El Paso, TX |
$4.93 | -13% |
|
68 |
Allentown-Bethlehem-Easton, PA-NJ |
$3.73 | -24% |
|
69 |
Baton Rouge, LA |
$4.73 | -17% |
|
70 |
McAllen-Edinburg-Mission, TX |
NA | #VALUE! |
|
71 |
Dayton, OH |
$6.02 | 3% |
|
72 |
Columbia, SC |
$4.02 | -13% |
|
73 |
Greensboro-High Point, NC |
$4.11 | -22% |
|
74 |
$8.38 | 11% | |
|
75 |
Little Rock-North Little Rock-Conway, AR |
$3.02 | -15% |
|
76 |
$9.63 | -20% | |
|
77 |
Akron, OH |
$7.56 | 5% |
|
78 |
Charleston-North Charleston, SC |
$9.22 | 1% |
|
79 |
Colorado Springs, CO |
$9.35 | -11% |
|
80 |
Syracuse, NY |
$3.51 | -18% |
|
81 |
Winston-Salem, NC |
$4.21 | -4% |
|
82 |
$8.75 | 8% | |
|
83 |
Boise City, ID |
$7.86 | -13% |
|
84 |
Wichita, KS |
$4.41 | 6% |
|
85 |
Springfield, MA |
NA | #VALUE! |
|
86 |
Madison, WI |
$5.74 | -2% |
|
87 |
$5.92 | 33% | |
|
88 |
Ogden-Clearfield, UT |
$7.84 | -10% |
|
89 |
Toledo, OH |
NA | #VALUE! |
|
90 |
$7.06 | -9% | |
|
91 |
Des Moines-West Des Moines, IA |
$9.29 | -7% |
|
92 |
Jackson, MS |
$4.11 | 3% |
|
93 |
Augusta-Richmond County, GA-SC |
$4.18 | -10% |
|
94 |
Scranton–Wilkes-Barre–Hazleton, PA |
NA | #VALUE! |
|
95 |
Youngstown-Warren-Boardman, OH-PA |
$4.30 | -26% |
|
96 |
Harrisburg-Carlisle, PA |
$6.49 | 1% |
|
97 |
Provo-Orem, UT |
$10.02 | -2% |
|
98 |
$6.98 | 10% | |
|
99 |
Chattanooga, TN-GA |
$5.31 | -11% |
|
100 |
Spokane-Spokane Valley, WA |
$11.73 | -4% |
Additional Google Real Estate Lead Gen Resources from CINC:
With the real estate market shifting, it is more important than ever to be more efficient paying for leads on Google. Try our free local Google real estate targeting tool here to find hidden pockets of more cost effective hyper-local leads near you.
.png?width=2240&height=800&name=Secret%20Submarket%20Finder%20Tool%20(1).png)
Watch our recent on-demand real estate lead gen webinar here where we discuss new trends for real estate teams and agents on Google Ads, including a deep dive on Google Local Service Ads (LSA's) for realtors.
Here are links to past historic Buyer Cost Per Lead Reports for Q2 2023, Q1 2023, Q4 2022, Q3 2022, Q2 2022, Q1 2022, Q4 2021, Q3 2021, Q2 2021, Q1 2021, Q4 2020, Q3 2020, Q2 2020, Q1 2020.