

.svg)

.png)


.png?width=770&height=434&name=Q3%202023%20Google%20Seller%20Real%20Estate%20Lead%20Cost%20Report%20(600%20%C3%97%20350%20px).png)
The cost of Google seller leads decreased in 64% of measured Top 100 markets in the 3rd quarter of 2023 (in CINC's portfolio of ad spend for real estate team and agent clients) compared to Q2 2023.
The 3 markets that saw the largest seller lead cost declines, Melbourne (FL), Cincinnati (OH), and Greensboro (NC), saw seller leads costs decrease by more than 50% quarter-over-quarter.
Fort Wayne, Indiana became the lowest seller lead cost market at $4.20 per seller lead, supplanting Buffalo (ranked #2) who had been in the #1 spot the prior two quarters.
Similar to our recently release of buyer lead cost data (see our recent Google Buyer Real Estate Lead Cost Report here), the largest markets that saw the largest seller lead cost declines were concentrated out West, with Portland (OR) (ranked #1 for large markets), San Bernardino (CA) (#2), and San Francisco (CA) (#4).
The Google Seller CPL (cost per lead) has been historically low and is a trend we have continued to see persist in early Q4.
CINC is the leader in online real estate lead generation with more than 50,000 clients. This behind-the-scenes lead cost data is what we were seeing for our portfolio of real estate team and agent clients during Q3 2023. The CINC client marketing team manages almost $30 million in search and social advertising spend annually for real estate teams and agents across the United States and Canada. If you want to see how CINC can help you find more higher quality hyperlocal real estate leads on Google, request a demo here.
Biggest Markets with Biggest Real Estate Lead Cost Decreases for Sellers on Google
The biggest US markets (based on population) where CINC real estate clients had the lowest seller cost per lead on Google in Q3 2023.
Of the largest US markets, 3 of the 4 largest seller lead cost declines were out West in Seattle (WA), San Bernardino (CA) , and San Francisco (CA). Each market saw seller lead costs drop over 25% quarter-over-quarter.

Pictured Above: San Bernardino (CA), ranked #2 in Biggest Markets with Biggest Real Estate Lead Cost Decreases for Sellers on Google.
The other markets in the Top 10 were all concentrated in the Northeast and Northern Midwest.
| Market Rank | Market | Seller Cost Per Lead (CPL) on Google | % Change Quarter-Over-Quarter |
| 1 | Seattle-Tacoma-Bellevue, WA | $12.79 | -35% |
| 2 | Riverside-San Bernardino-Ontario, CA | $15.90 | -35% |
| 3 | St. Louis, MO-IL | $6.58 | -35% |
| 4 | San Francisco-Oakland-Hayward, CA | $14.86 | -28% |
| 5 | Washington-Arlington-Alexandria, DC-VA-MD-WV | $10.95 | -19% |
| 6 | Baltimore-Columbia-Towson, MD | $10.50 | -19% |
| 7 | New York-Newark-Jersey City, NY-NJ-PA | $14.72 | -14% |
| 8 | Boston-Cambridge-Newton, MA-NH | $14.67 | -12% |
| 9 | Chicago-Naperville-Elgin, IL-IN-WI | $8.02 | -11% |
| 10 | Detroit-Warren-Dearborn, MI | $7.16 | -10% |
Biggest Real Estate Lead Cost Declines for Sellers on Google for Top 100 Markets
US markets with the largest seller cost per lead (CPL) declines on Google quarter-over-quarter in Q3 2023.
Of all markets, Melbourne (FL), Cincinnati (OH), and Greensboro (NC) saw the largest declines in seller lead costs with all seeing a quarter-over-quarter decline over 50%.
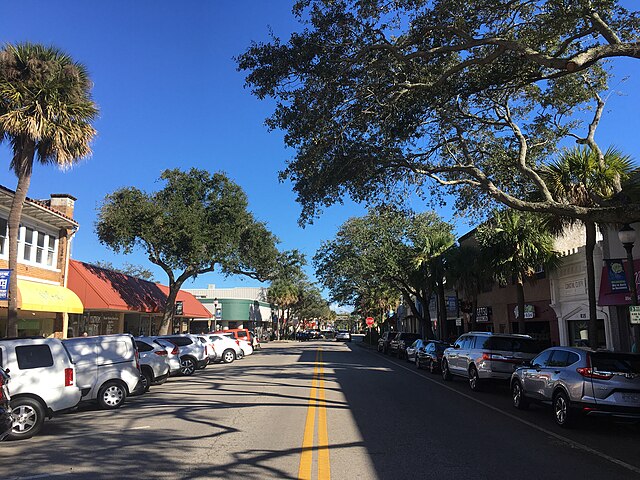
Pictured Above: Melbourne (FL), ranked #1 in Biggest Real Estate Lead Cost Declines for Sellers on Google for Top 100 Markets.
Half of the Top 10 markets that saw the largest seller lead cost declines were all in the South.
| Market Rank | Market | Seller Cost Per Lead (CPL) on Google | % Change Quarter-Over-Quarter |
| 1 | Palm Bay-Melbourne-Titusville, FL | $8.08 | -75% |
| 2 | Cincinnati, OH-KY-IN | $5.22 | -57% |
| 3 | Greensboro-High Point, NC | $5.26 | -56% |
| 4 | El Paso, TX | $10.68 | -48% |
| 5 | Provo-Orem, UT | $12.14 | -45% |
| 6 | Seattle-Tacoma-Bellevue, WA | $12.79 | -35% |
| 7 | Riverside-San Bernardino-Ontario, CA | $15.90 | -35% |
| 8 | St. Louis, MO-IL | $6.58 | -35% |
| 9 | Memphis, TN-MS-AR | $7.23 | -34% |
| 10 | Austin-Round Rock, TX | $12.75 | -33% |
Lowest Real Estate Lead Cost Markets for Sellers on Google
The top 10 markets where CINC real estate clients had the lowest seller cost per lead on Google in Q3 2023.
Fort Wayne (IN), moved up to the #1 spot (from #9 spot last quarter) in the lowest seller lead cost markets, with a very low $4.20 per lead.

Pictured Above: Fort Wayne (IN), ranked #1 in Lowest Real Estate Lead Cost Markets for Sellers on Google.
3 of the 4 lowest cost markets were in either Ohio or Indiana.
| Market Rank | Market | Seller Cost Per Lead (CPL) on Google |
| 1 | Fort Wayne, IN | $4.20 |
| 2 | Buffalo-Cheektowaga-Niagara Falls, NY | $4.52 |
| 3 | Cleveland-Elyria, OH | $4.54 |
| 4 | Cincinnati, OH-KY-IN | $5.22 |
| 5 | Greensboro-High Point, NC | $5.26 |
| 6 | Homosassa Springs, FL | $6.36 |
| 7 | St. Louis, MO-IL | $6.58 |
| 8 | Roanoke, VA | $6.98 |
| 9 | Tulsa, OK | $7.10 |
| 10 | Detroit-Warren-Dearborn, MI | $7.16 |
Real Estate Lead Cost for Sellers on Google for Top 100 Markets
The Google seller cost per lead for CINC real estate clients in Q3 2023 in the top 100 US markets based on population.
| Market Rank | Market | Seller Cost Per Lead (CPL) on Google | % Change Quarter-Over-Quarter |
| 1 | New York-Newark-Jersey City, NY-NJ-PA | $14.72 | -14% |
| 2 | Los Angeles-Long Beach-Anaheim, CA | $19.13 | 18% |
| 3 | Chicago-Naperville-Elgin, IL-IN-WI | $8.02 | -11% |
| 4 | Dallas-Fort Worth-Arlington, TX | $14.20 | 45% |
| 5 | Houston-The Woodlands-Sugar Land, TX | $14.20 | 27% |
| 6 | Philadelphia-Camden-Wilmington, PA-NJ-DE-MD | $14.11 | 11% |
| 7 | Washington-Arlington-Alexandria, DC-VA-MD-WV | $10.95 | -19% |
| 8 | Miami-Fort Lauderdale-West Palm Beach, FL | $17.51 | 2% |
| 9 | Atlanta-Sandy Springs-Roswell, GA | $12.63 | -5% |
| 10 | Boston-Cambridge-Newton, MA-NH | $14.67 | -12% |
| 11 | San Francisco-Oakland-Hayward, CA | $14.86 | -28% |
| 12 | Riverside-San Bernardino-Ontario, CA | $15.90 | -35% |
| 13 | Phoenix-Mesa-Scottsdale, AZ | $16.97 | 4% |
| 14 | Detroit-Warren-Dearborn, MI | $7.16 | -10% |
| 15 | Seattle-Tacoma-Bellevue, WA | $12.79 | -35% |
| 16 | Minneapolis-St. Paul-Bloomington, MN-WI | $17.07 | 8% |
| 17 | San Diego-Carlsbad, CA | $35.51 | -6% |
| 18 | Tampa-St. Petersburg-Clearwater, FL | $14.22 | -3% |
| 19 | St. Louis, MO-IL | $6.58 | -35% |
| 20 | Baltimore-Columbia-Towson, MD | $10.50 | -19% |
| 21 | Denver-Aurora-Lakewood, CO | $12.78 | 33% |
| 22 | Pittsburgh, PA | NA | #VALUE! |
| 23 | Charlotte-Concord-Gastonia, NC-SC | $10.98 | -8% |
| 24 | Portland-Vancouver-Hillsboro, OR-WA | $12.23 | 5% |
| 25 | San Antonio-New Braunfels, TX | NA | #VALUE! |
| 26 | Orlando-Kissimmee-Sanford, FL | $13.20 | -7% |
| 27 | Sacramento--Roseville--Arden-Arcade, CA | $27.75 | -1% |
| 28 | Cincinnati, OH-KY-IN | $5.22 | -57% |
| 29 | Cleveland-Elyria, OH | $4.54 | -20% |
| 30 | Kansas City, MO-KS | $9.06 | -2% |
| 31 | Las Vegas-Henderson-Paradise, NV | $14.06 | 0% |
| 32 | Columbus, OH | $9.96 | -27% |
| 33 | Indianapolis-Carmel-Anderson, IN | $10.11 | 3% |
| 34 | San Jose-Sunnyvale-Santa Clara, CA | NA | #VALUE! |
| 35 | Austin-Round Rock, TX | $12.75 | -33% |
| 36 | Nashville-Davidson--Murfreesboro--Franklin, TN | $10.17 | -17% |
| 37 | Virginia Beach-Norfolk-Newport News, VA-NC | $14.76 | -15% |
| 38 | Providence-Warwick, RI-MA | $15.32 | -18% |
| 39 | Milwaukee-Waukesha-West Allis, WI | $10.14 | -15% |
| 40 | Jacksonville, FL | $8.33 | -27% |
| 41 | Memphis, TN-MS-AR | $7.23 | -34% |
| 42 | Oklahoma City, OK | NA | #VALUE! |
| 43 | Louisville/Jefferson County, KY-IN | $8.95 | -21% |
| 44 | Richmond, VA | $14.80 | 62% |
| 45 | New Orleans-Metairie, LA | NA | #VALUE! |
| 46 | Hartford-West Hartford-East Hartford, CT | $44.29 | #VALUE! |
| 47 | Raleigh, NC | $13.38 | 4% |
| 48 | Birmingham-Hoover, AL | NA | #VALUE! |
| 49 | Buffalo-Cheektowaga-Niagara Falls, NY | $4.52 | 0% |
| 50 | Salt Lake City, UT | $15.83 | -3% |
| 51 | Rochester, NY | NA | #VALUE! |
| 52 | Grand Rapids-Wyoming, MI | $9.97 | -26% |
| 53 | Tucson, AZ | $26.64 | 5% |
| 54 | Urban Honolulu, HI | $14.31 | 34% |
| 55 | Tulsa, OK | $7.10 | 20% |
| 56 | Fresno, CA | NA | #VALUE! |
| 57 | Bridgeport-Stamford-Norwalk, CT | $12.15 | -9% |
| 58 | Worcester, MA-CT | $17.21 | 3% |
| 59 | Albuquerque, NM | $11.39 | -5% |
| 60 | Omaha-Council Bluffs, NE-IA | NA | #VALUE! |
| 61 | Albany-Schenectady-Troy, NY | $9.26 | 0% |
| 62 | New Haven-Milford, CT | NA | #VALUE! |
| 63 | Bakersfield, CA | $8.03 | -24% |
| 64 | Knoxville, TN | $9.62 | -4% |
| 65 | Greenville-Anderson-Mauldin, SC | NA | #VALUE! |
| 66 | Oxnard-Thousand Oaks-Ventura, CA | NA | #VALUE! |
| 67 | El Paso, TX | $10.68 | -48% |
| 68 | Allentown-Bethlehem-Easton, PA-NJ | NA | #VALUE! |
| 69 | Baton Rouge, LA | $10.37 | -15% |
| 70 | McAllen-Edinburg-Mission, TX | NA | #VALUE! |
| 71 | Dayton, OH | $7.99 | 2% |
| 72 | Columbia, SC | NA | #VALUE! |
| 73 | Greensboro-High Point, NC | $5.26 | -56% |
| 74 | North Port-Sarasota-Bradenton, FL | $15.89 | 1% |
| 75 | Little Rock-North Little Rock-Conway, AR | NA | #VALUE! |
| 76 | Stockton-Lodi, CA | NA | #VALUE! |
| 77 | Akron, OH | NA | #VALUE! |
| 78 | Charleston-North Charleston, SC | $26.06 | -10% |
| 79 | Colorado Springs, CO | $18.43 | 21% |
| 80 | Syracuse, NY | NA | #VALUE! |
| 81 | Winston-Salem, NC | $7.63 | 17% |
| 82 | Cape Coral-Fort Myers, FL | $14.21 | -10% |
| 83 | Boise City, ID | NA | #VALUE! |
| 84 | Wichita, KS | $9.04 | -24% |
| 85 | Springfield, MA | NA | #VALUE! |
| 86 | Madison, WI | $11.29 | -21% |
| 87 | Lakeland-Winter Haven, FL | NA | #VALUE! |
| 88 | Ogden-Clearfield, UT | NA | #VALUE! |
| 89 | Toledo, OH | NA | #VALUE! |
| 90 | Deltona-Daytona Beach-Ormond Beach, FL | $17.28 | -10% |
| 91 | Des Moines-West Des Moines, IA | NA | #VALUE! |
| 92 | Jackson, MS | NA | #VALUE! |
| 93 | Augusta-Richmond County, GA-SC | $9.69 | -22% |
| 94 | Scranton–Wilkes-Barre–Hazleton, PA | NA | #VALUE! |
| 95 | Youngstown-Warren-Boardman, OH-PA | NA | #VALUE! |
| 96 | Harrisburg-Carlisle, PA | $11.14 | 2% |
| 97 | Provo-Orem, UT | $12.14 | -45% |
| 98 | Palm Bay-Melbourne-Titusville, FL | $8.08 | -75% |
| 99 | Chattanooga, TN-GA | $12.30 | 0% |
| 100 | Spokane-Spokane Valley, WA | $15.97 | -12% |
Additional Google Real Estate Lead Gen Resources from CINC:
In a shifting real estate market, it is more important than ever to be more efficient paying for leads on Google. Try our free local Google real estate targeting tool here to find hidden pockets of more cost effective hyper-local leads near you.
.png?width=2240&height=800&name=Secret%20Submarket%20Finder%20Tool%20(1).png)
Watch our recent on-demand real estate lead gen webinar here where we discuss new trends for real estate teams and agents on Google Ads, including a deep dive on Google Local Service Ads (LSA's) for realtors.
Here are links to past historic Real Estate Seller Cost Per Lead Reports for Q2 2023, Q1 2023, Q4 2022, Q3 2022, Q2 2022, Q1 2022, Q4 2021, Q3 2021, Q2 2021, Q1 2021.